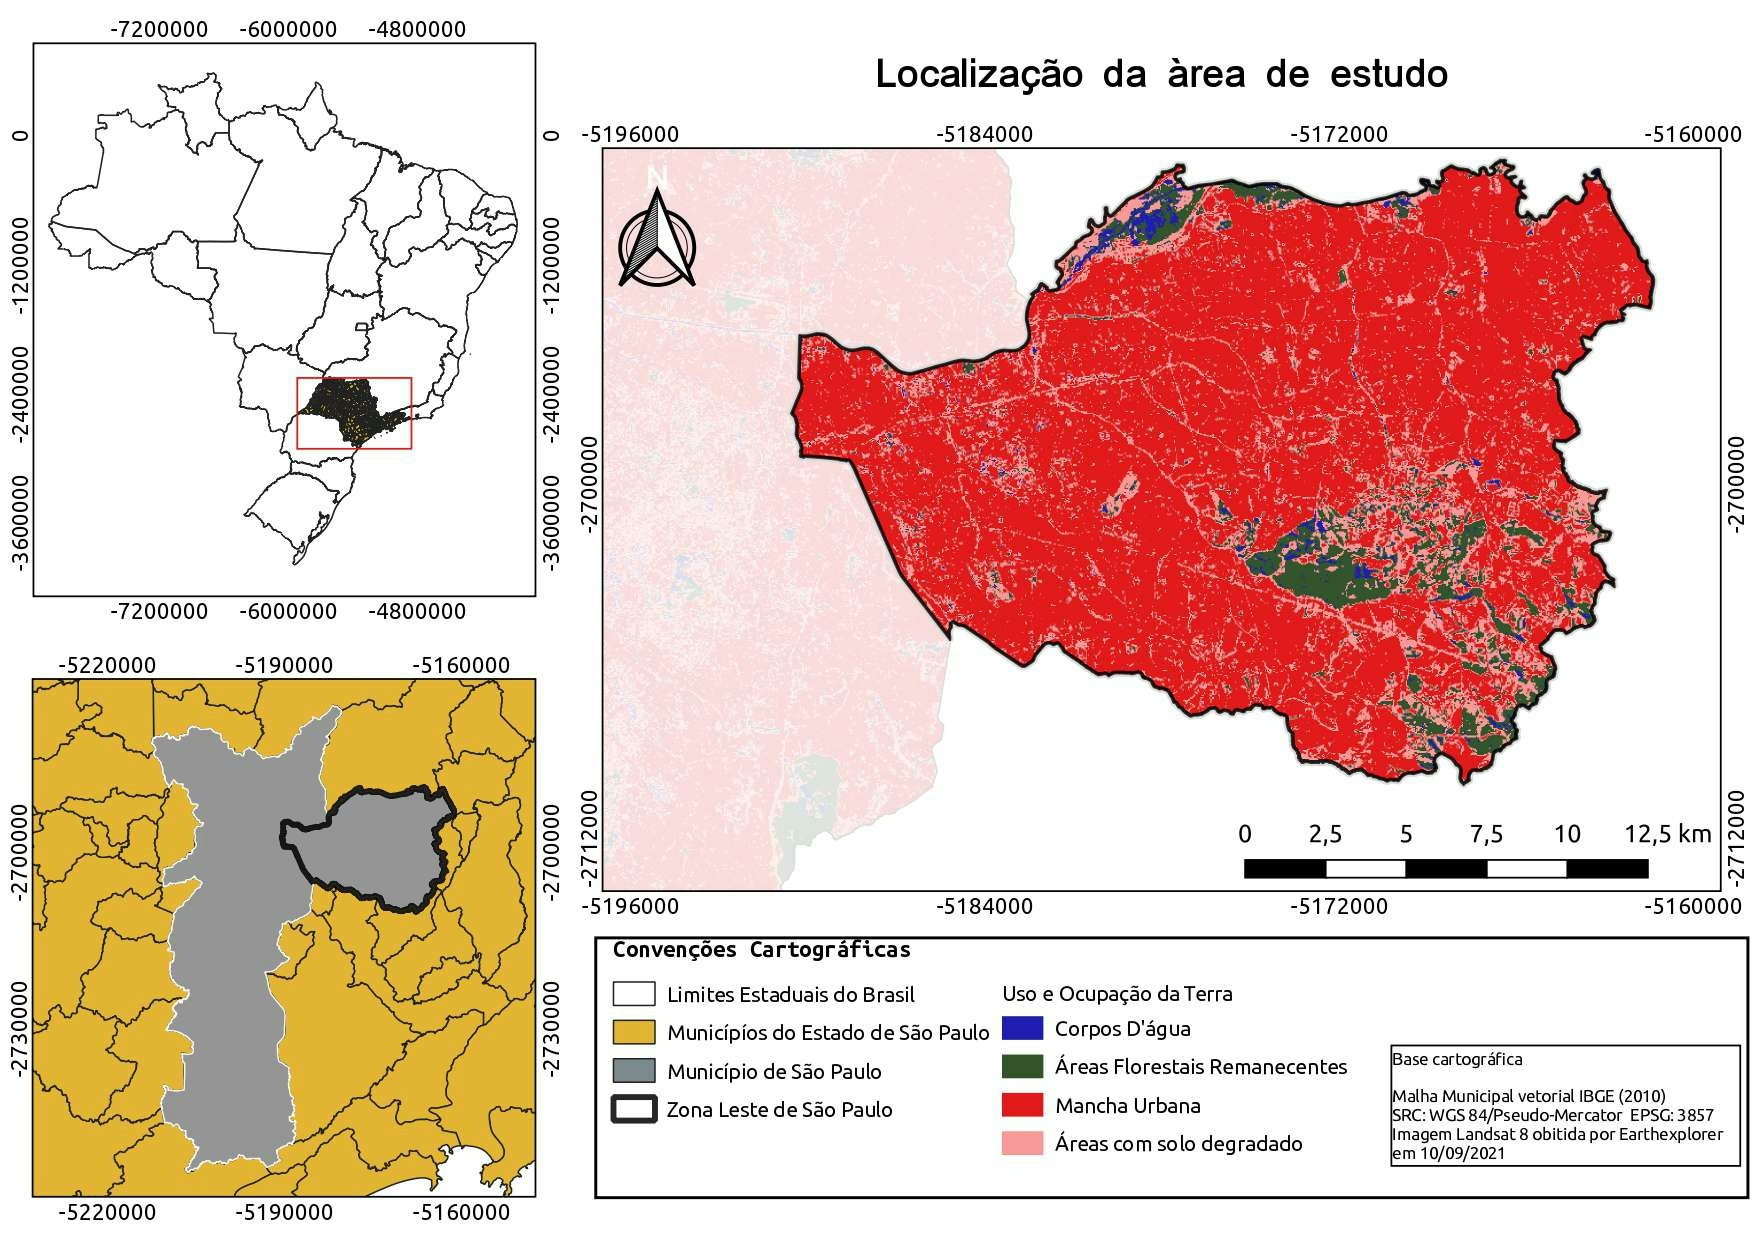
As part of Elections Canada's Special Research Project that I led on ascertaining demographic data and media sentiment analysis of the Filipino Canadian community to help bolster the government agency's outreach to Canada's ethnic communities, I generated 4 different choropleth maps (by Canadian federal electoral districts, or ridings, based on the 2013 Representation Order) representing 4 different variables (they are displayed in the exact same order as the list below):
MAP 1: Growth Rate of the Filipino Canadian Population, 2016-2021
MAP 2: % of Filipinos by Riding
MAP 3: Most-Used Non-Tagalog Philippine-Based Languages by Riding
MAP 4: % of Recent Immigrants (2016-2021) from the Philippines by Riding
Data and Datasets:
Census Profile, 2021 Census of Population:https://www12.statcan.gc.ca/census-recensement/2021/dp-pd/prof/index.cfm?Lang=E
Census Profile, 2016 Census of Population:https://www12.statcan.gc.ca/census-recensement/2016/dp-pd/prof/index.cfm?Lang=E
2021 Census – Boundary files:https://www12.statcan.gc.ca/census-recensement/2021/geo/sip-pis/boundary-limites/index2021-eng.cfm?year=21
Code Snippet Used for Geospatial Portion:
# R code used for choropleth maps #
#################################
## INSTALL NECESSARY PACKAGES  ##
#################################
install.packages("ggplot2")
install.packages("sf")

library(ggplot2)
library(sf)

###############################
## IMPORT AND EXPLORE DATA  ##
###############################

Data <- fread("C:/Users/LB0009/Downloads/Scraped Data From Statistics Canada.csv")
View(Data)

###########################
## GEOSPATIAL ANALYSIS  ##
###########################

#Download shapefile of elecotral boundaries (2013 representation order)
my_sf <- read_sf("C:/Users/LB0009/Downloads/lfed000b21a_e")

head(my_sf)

#Merge shapefile with csv file, joined through the names of the electoral districts
my_sf_merged <- my_sf %>%
  left_join(Data, by = c("FEDENAME" = "Electoral District (2013 Representation Order)"))

#Map % of Filipinos by Riding
my_sf_merged$FilipinoPercentClass <-
  cut(my_sf_merged$`% Filipinos`, breaks =c(-Inf,1,2.5,5,10,20,50,Inf),
      labels=c('>0% but <1%%', '1-2.5%', '2.5-5%','5-10%', '10-20%', '20-50%', '>50%'))
Map1 <- ggplot(my_sf_merged) +
  geom_sf(aes(fill = FilipinoPercentClass), color='gray',data=my_sf_merged) +
  geom_sf(fill='transparent', color='white', data=my_sf_merged) +
  scale_fill_brewer(name='% Filipinos') +
  labs(title='Proportion of Filipinos by Riding',
       caption=c('Source: Statistics Canada')) +
  theme_gray() +
  theme(title=element_text(face='bold'), legend.position='bottom')
Map1


#Map % of Recent Immigrants (2016-2021) Coming from the Philippines
my_sf_merged$RecentImmClass <-
  cut(my_sf_merged$`% of Recent Immigrants from PH (2016-2021)`, breaks=c(0,5,10,20,50,Inf),
      labels=c('<5%', '5-10%', '10-20%', '20-50%', '>50%'))
Map2 <- ggplot(my_sf_merged) +
  geom_sf(aes(fill = RecentImmClass), color='gray',data=my_sf_merged) +
  geom_sf(fill='transparent', color='white', data=my_sf_merged) +
  scale_fill_brewer(name='% Recent Immigrants from PH') +
  labs(title='Proportion of Recent Immigrants (2016-2021) That Come from The Philippines',
       caption=c('Source: Statistics Canada')) +
  theme_gray() +
  theme(title=element_text(face='bold'), legend.position='bottom')
Map2


#Map Filipino Growth Rate (2016-2021)
my_sf_merged$GrowthRateClass <-
  cut(my_sf_merged$`Filipino Growth Rate % (2016-2021)`, breaks=c(-200,0,10,25,50,100,200,500,Inf),
      labels=c('<0%', '0-10%', '10-25%', '25-50%','50-100%','100-200','200-500%' ,'>500%'))
Map3 <- ggplot(my_sf_merged) +
  geom_sf(aes(fill = GrowthRateClass), color='transparent',data=my_sf_merged) +
  geom_sf(fill='transparent', color='white', data=my_sf_merged) +
  scale_fill_brewer(name='% Change, 2016-2021') +
  labs(title='Growth rate of Filipino population (2016-2021)',
       caption=c('Source: Statistics Canada')) +
  theme_gray() +
  theme(title=element_text(face='bold'), legend.position='bottom')
Map3


#Map Secondary Philippine Language Usage
my_sf_merged$SecondLangClass <- my_sf_merged$`Second Most Spoken Philippine Language`

Map4 <- ggplot(my_sf_merged) +
  geom_sf(aes(fill = SecondLangClass), color='transparent',data=my_sf_merged) +
  geom_sf(fill='transparent', color='white', data=my_sf_merged) +
  scale_fill_viridis_d(name='Secondary Language') +
  scale_fill_discrete() +
  scale_colour_grey() +
  labs(title='Usage of Secondary Filipino Languages',
       caption=c('Source: Statistics Canada')) +
  theme_void() +
  theme(title=element_text(face='bold'), legend.position='bottom')
Map4


.svg "Keran Nkongolo")