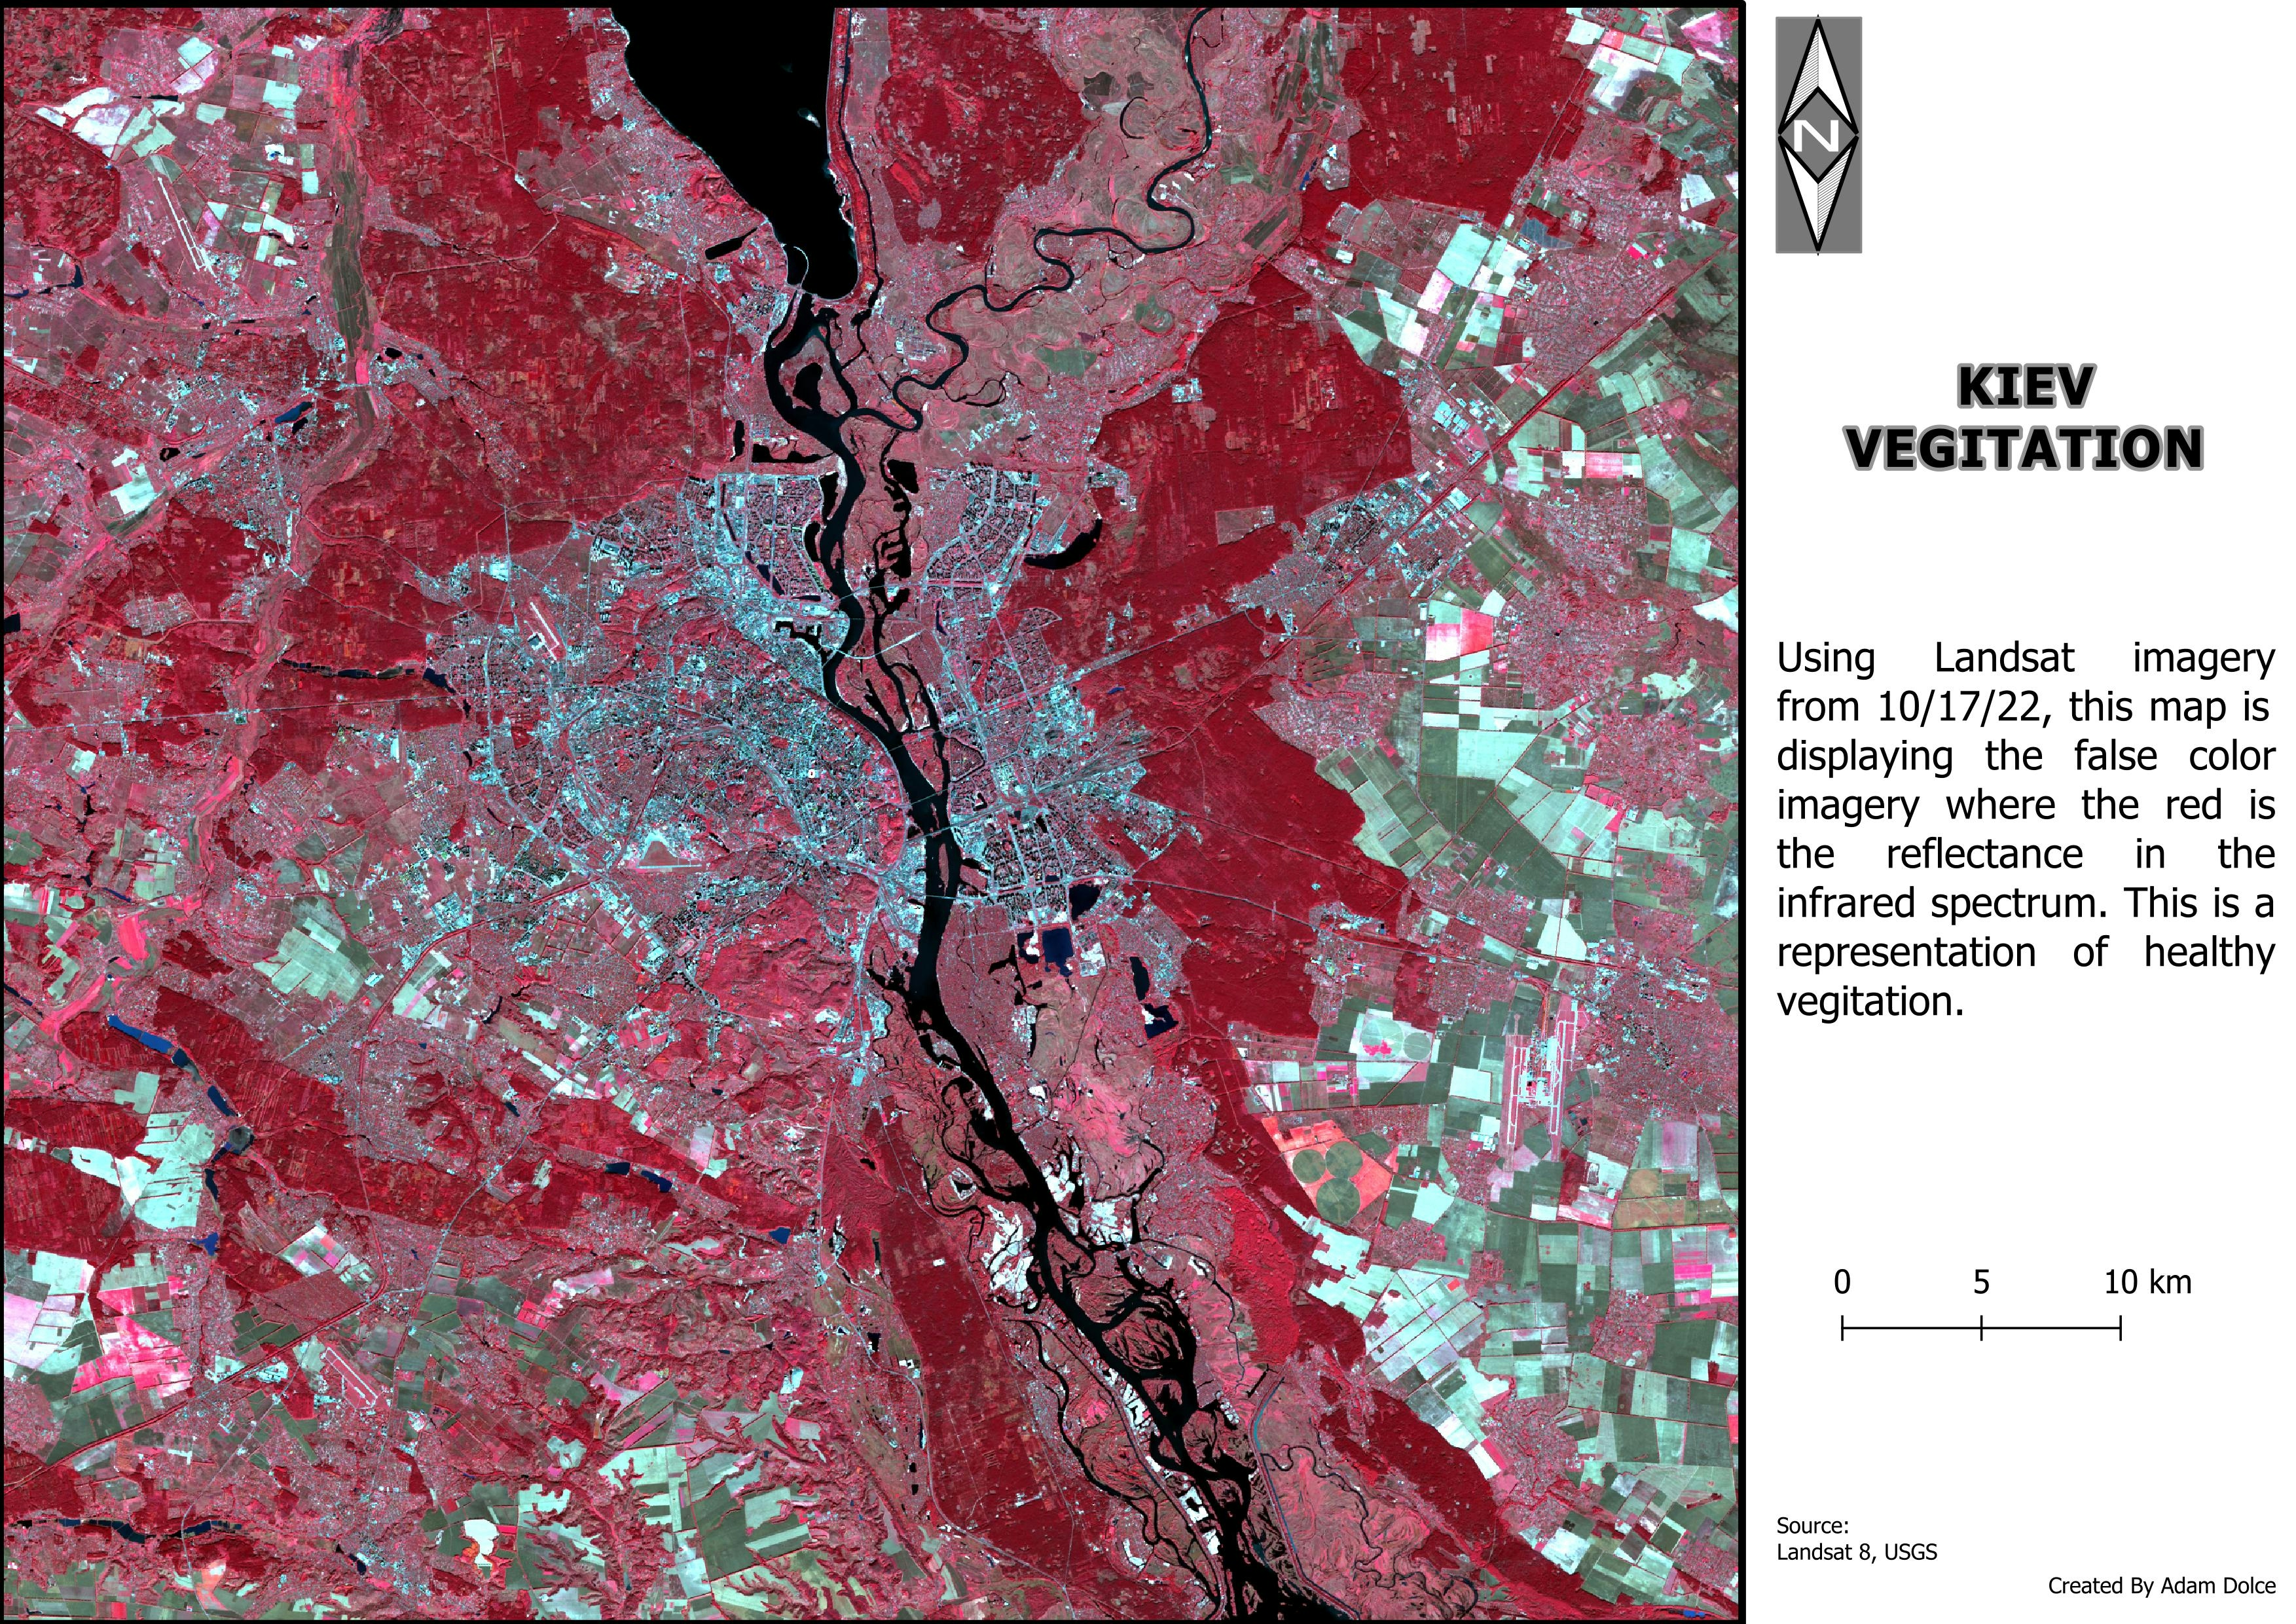
Normalized Difference Vegetation Index (NDVI) quantifies vegetation by measuring the difference between near-infrared that vegetation strongly reflects and red light that vegetation absorbs. It is used to quantify vegetation greenness and understand vegetation density. The Landsat 8-9 bands; 5 and 4 were downloaded from USGS EarthExplorer and imported into Arc Map. NDVI was calculated using the following formula: (Band NIR - Band R)/ (Band NIR + Band R) delivered as a single band. The range of values is from -1 to +1 with NDVI values interpretation as follows:
· Below 0 indicates water
· Between 0 and 0.3 – Barren areas with little or no vegetation cover
· Between 0.3 and 0.6 – Sparse vegetation cover
· Between 0.6 and 0.9 – Dense and healthy vegetation cover
· Above 0.9 – Very dense vegetation cover
The NDVI 2014 ranges from 0.029 to 0.47 while the NDVI 2024 ranges from 0.006 to 0.43 showing a slight reduction in vegetation cover. The diagram 3 depicts the change in vegetation cover from 2014 to 2024.