According to the World Meteorological Organization, Climate is the average weather conditions of a particular location over a long period of time.
Climate Change is the long-term, significant variation of average weather conditions over a long period of time.
These variations can be natural, due to the changes in the activity of the sun.
But, according to the United Nations, since the 1800s, human activities have been the main driver of climate change.
Humans continue to increase greenhouse gas levels in the atmosphere through anthropogenic activities, which include deforestation and burning fossil fuels like coal, oil, and gas.
Key factors that contribute to climate change
The concentration of greenhouse gas emissions (Carbon dioxide and Methane) in the atmosphere is a major indicator of climate change.
But how do these greenhouse gases generate?
It generates from:
· How we make and use electricity
· How we get ourselves around in transportation
· How we produce things in the industry
· How we process energy
· How we operate our buildings
Energy, Electricity, Industry, Transport, Buildings, Agriculture, and Land Use are some of the main sectors causing greenhouse gases.
Let’s explore these more.
Trees and plants receive carbon dioxide, which they convert to carbon and store in their stems, branches, trunks, and leaves. But when we cut down trees, clear the forest, and burn them, carbon dioxide is released into the atmosphere, which causes increasing levels of greenhouse gases.
According to the U.S. Environmental Protection Agency, electricity generation is the second largest emitter of carbon dioxide.
Electricity production accounts for about 25% of the greenhouse gases emitted globally. Huge, right?
Transportation (vehicles powered by fossil fuels) is also a major source of pollution in the atmosphere and the largest source of heat-trapping emissions in the United States.
We must make conscious efforts now more than ever to address this climate change crisis to make our community and the world a safer, healthier, and better place to live.
Let’s make the world a safer, healthier, and better place to live!
How can GIS be used to address the climate crisis?
GIS can help us answer questions like; How often are we going to flood? How much more severe are our heat waves going to get? How can we protect the people living here from these changes?
It is a known fact that the climate is changing in unprecedented ways. However, there are still various options to alleviate the impacts. We will be exploring two ways, adaptation and mitigation.
Adaptation
Predictions must go beyond what the weather will be to include what the weather will do.
One sure way we can minimize the impacts of the climate crisis we are facing is to put early warning systems in place. This will allow people to know hazardous weather is on its way and will also inform how the government, communities, and individuals can act to minimize the impacts.
Reports have shown that one-third of the world’s people are still not covered by early warning systems: about 41% of Africa is still not covered by early warning systems.
How can GIS be used in Adaptation?
ArcGIS Story Maps can be used to create a story that integrates GIS-based visuals to highlight the weather and climate findings of a particular location.
These findings can be used by communities and individuals to understand how climate is changing in the community and the gravity of the changes, which will in turn help them make conscious efforts and thereby minimize the impacts.
Check out this case study to understand more.
ArcGIS Web Apps and Dashboards can be used to present and visualize weather and climate data in an easy-to-read, interactive format.
These can be used to make data-driven decisions (for example, a farmer can check the real-time weather data of the community to know whether to plant that period), visualize trends, monitor real-time data, and inform communities.
Check out this real-time dashboard.
However, even if adaptation is improved, we should know it is not enough! The climate will continue to change unless the underlying contributors are addressed.
Which brings us to the second option: Mitigation.
Mitigation
With the rapid changes we are experiencing, we must mitigate or reduce greenhouse gas emissions from fossil fuels whenever possible.
How can GIS address this?
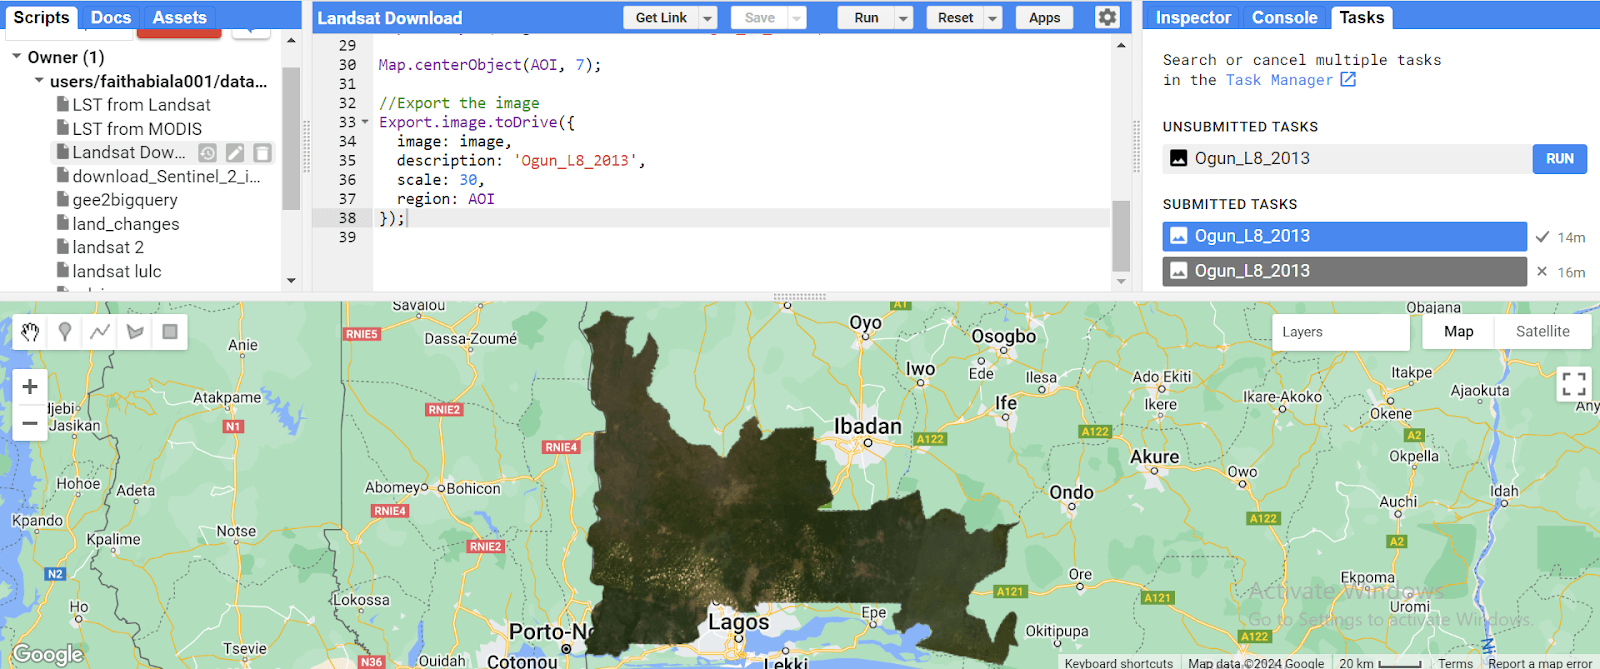
Using GIS to map deforestation in a particular location can be used to know the extent of damage and make informed decisions on how and where to replant.
Optimizing vehicle routes will reduce fuel consumption and greenhouse gas emissions by 10–30%.
GIS can be used to optimize vehicle routes and enhance operational efficiency through vehicle coordination and strategic route planning.
GIS can be used to plan strategic, optimized routes for vehicles to reduce greenhouse gas emissions and even fuel consumption.
Another sure way that we can reduce greenhouse gas emissions is by reducing our electricity consumption and embracing more clean, renewable energy.
Fortunately, the generation of renewables is growing considerably, but we can do more.
GIS can help us know where exactly to install our solar panels, on which building roof, and on what part of the roof exactly.
Embracing GIS to plan solar panel installation is an efficient move.
There are many ways GIS can be used to address the climate crisis in the world today. We have been able to explore a few.
Let’s all do our part in mitigating the impacts of climate change!


