
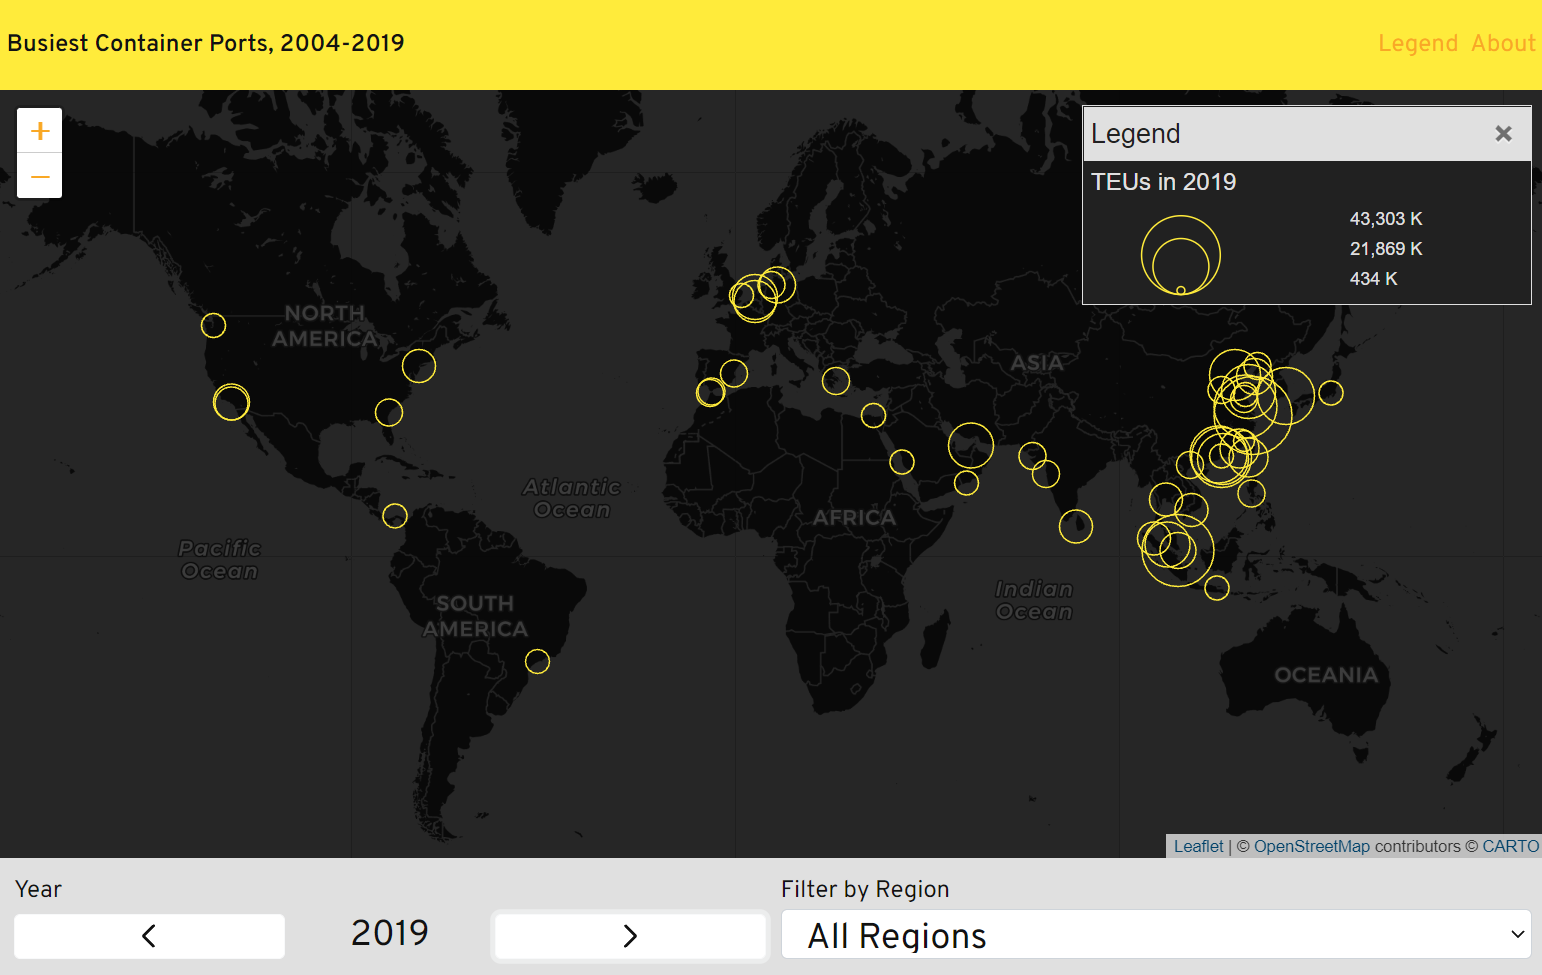
Created while taking a course in interactive cartography at the Universiy of Wisconsin, this application uses an examination of container port business in order to explore how to use JavaScript to give users the ability to filter the features on the map by multiple dimensions.
Busiest Container Ports, 2004-2019
Tools used
QGIS
Plug-ins used
BootstrapLeafletJS
tags
Data Visualization
More by Ryan Cooper
You might also like


![Lexical Map of [Shovel] in Malay Lang](/_next/image?url=https%3A%2F%2Fstorage.googleapis.com%2Fspatialnodefiles%2Fprojects%2FPetaDialekCangkul1_9000385.png&w=3840&q=100)


Join the community!
We're a place where geospatial professionals showcase their works and discover opportunities.