Like many other cities around the world, the City of Tacoma has a number of community gardens dotting its neighborhoods. Community Gardens are spaces where local community members can learn how to and actually cultivate food for their households. Through this sharing of knowledge, communities can develop resilience in the face of food insecurity, especially in areas where private green space is a premium. Being almost entirely volunteer-run and funded, these gardens are highly representative of community investment into this projects.
But the degree to which a community can participate in its local garden is restricted by the resources available to the community. For example, a lack of affordable housing would push households to focus on earning income rather than participating in unpaid labor. This is compounded with the fact that these gardens are primarily volunteer funded, thus gardens with lower levels of participation would not maintain as large of budgets for supplies, maintenance and the like. Unfortunately, as with many US cities, economic differences generally fall in line with demographics.
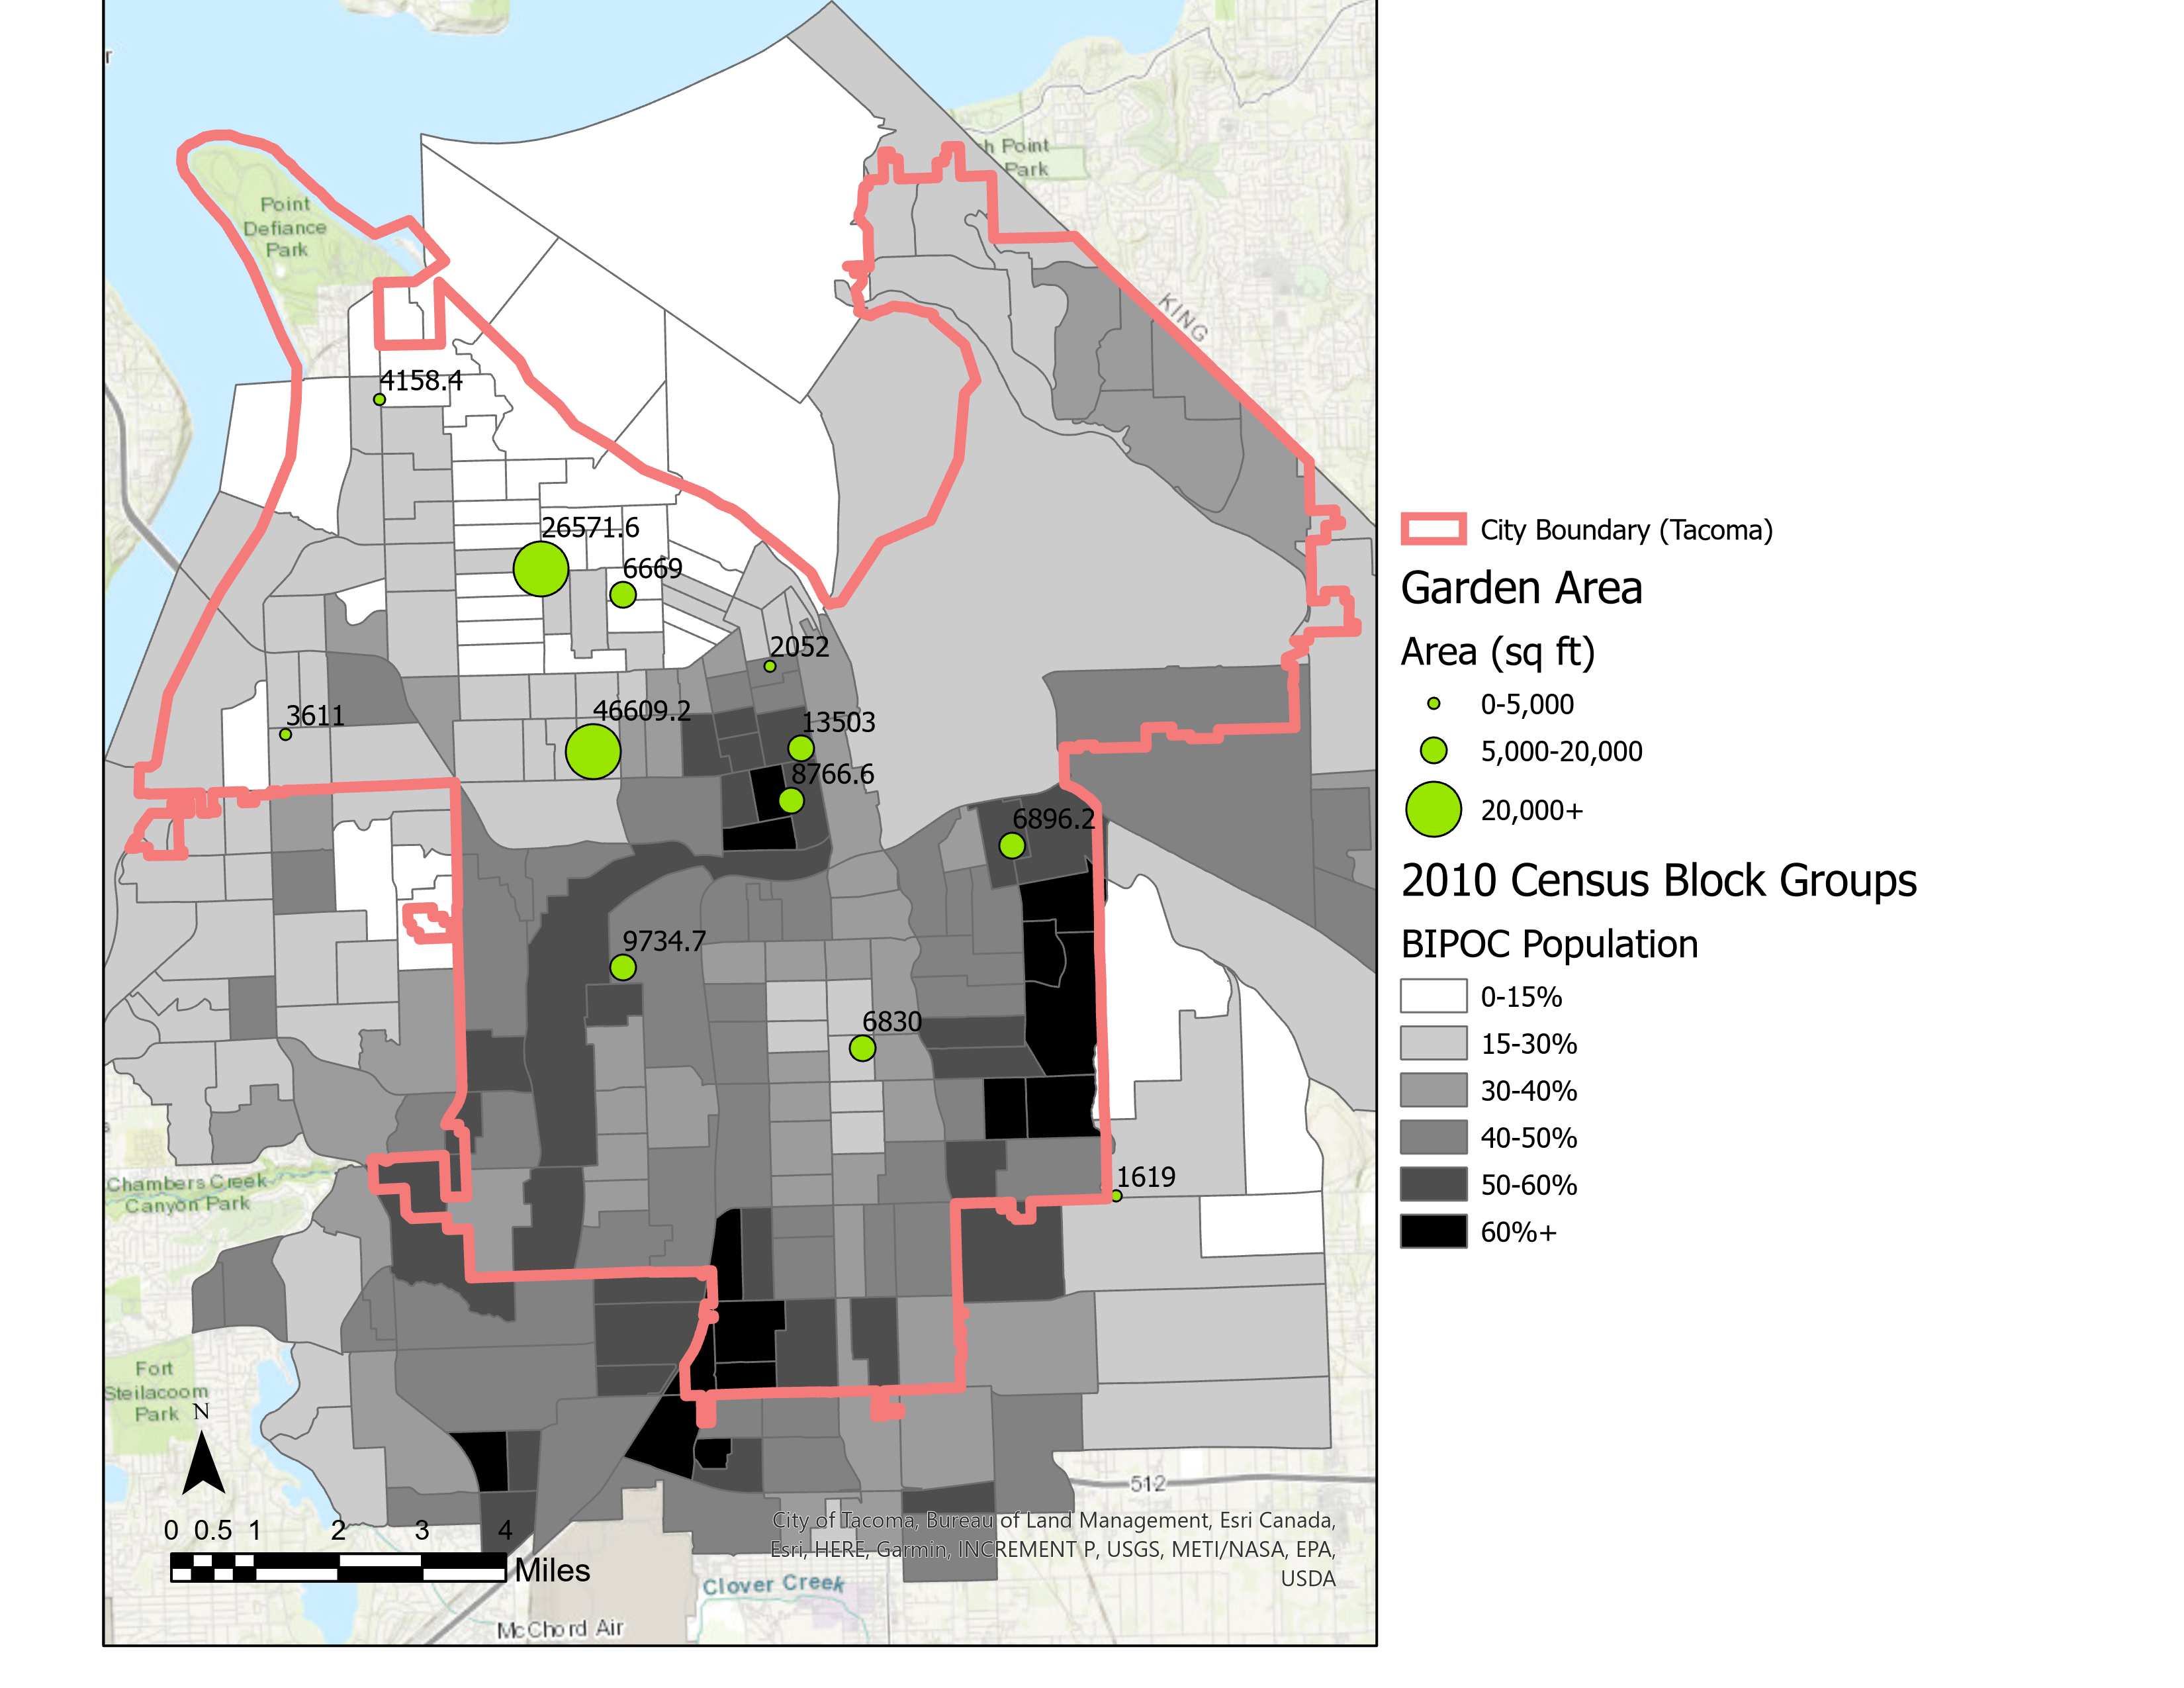
The map shown compares the area of a selected number of community gardens in Tacoma with the Black, Indigenous and People of Color (BIPOC) population for each census block group. These gardens were mapped using ArcGIS Collector on a mobile device before being uploaded to ArcGIS Online and then transferred to ArcGIS Pro for layout.
Generally speaking, BIPOC population is lower to the north and trends upwards to the south. Gardens are somewhat larger in the north compared to the south. To some degree, it does appear that lower BIPOC population is related to greater garden area, but the relationship is not definitive, indicating that there are other factors that restrict or enable participation in these gardens.
While this project was inconclusive, it was my first experience utilizing a mobile device for data collection and moving my data throughout the Esri suite to interrogate and understand the phenomena at hand. The biggest takeaway from the project was that data collection will always take longer than planned. The original plan called for 30 gardens to be surveyed, but issues with locating gardens, being caught in conversation with gardeners and travel time between locations limited the number of sites to just 12. This project taught me to set realistic expectations and disparities can not simply be explained by one or two metrics.


.png&w=3840&q=100)
 He")