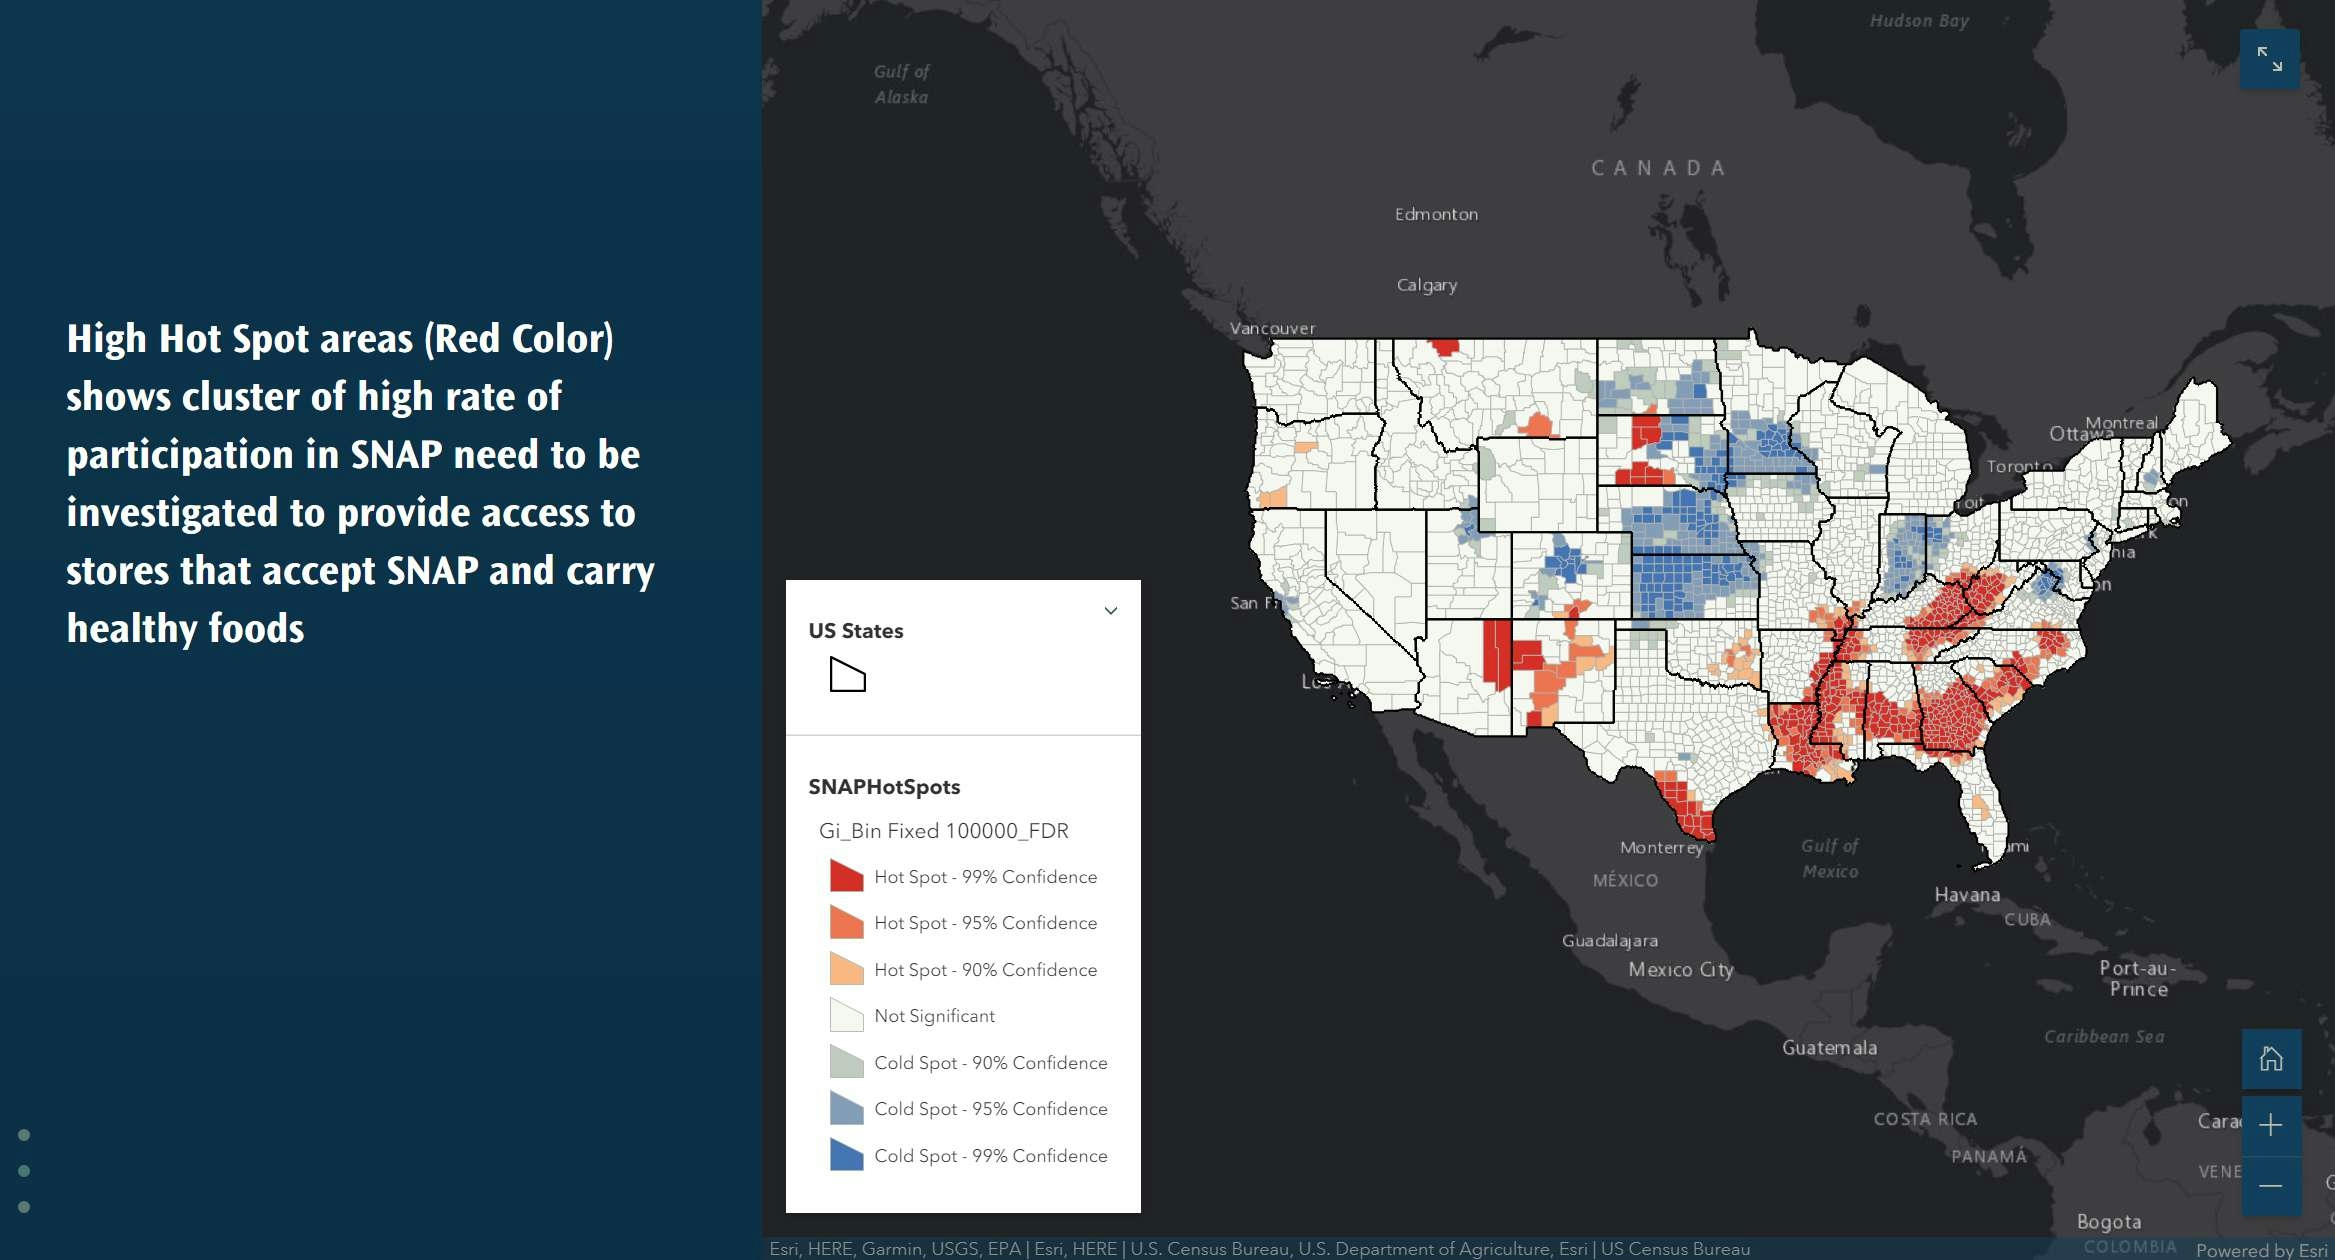
Learning Spatial and Temporal variation of rate of SNAP participation for effective resource allocation
Distribution of SNAP participation rate at the national level is needed to plan intervention and to develop policy guided by facts. The rate of population that participated in SNAP during 2016 is used to assess if there is any clustering at counties level and whether there are outliers within such clustering.
The analyst used ESRI spatial data science tools such as optimized hot spot and optimized outlier analysis for pattern recognition. The results are presented as story maps: https://storymaps.arcgis.com/stories/9e7d399492394f18abc9166dc9404291
This is part of ESRI Spatial Data Science MOOC.