Introduction
The following shall be touched upon in this article:
i. meaning of remote sensing
ii. meaning of spectral indices
iii. most common indices
iv. example and application
Remote sensing: this has been defined by numerous authors; for this article, I will stick to the definition of Campbell (2002): Remote sensing is the acquisition of information about an object or phenomenon without making physical contact with the object or phenomenon under investigation.
Many techniques have been used to acquire information about objects (features) in recent times. techniques like passive and active remote sensing, LIDAR remote sensing, RADAR remote sensing, and spectral remote sensing (Campbell, 2002).
Spectral Indices:
A spectral index is a mathematical combination of two or more wavelengths that enhances the information content of the data (Rouse et al., 1974). Spectral indices can be used to extract information about specific features or properties of the Earth’s surface, such as vegetation density, soil moisture, or water quality.
There are several spectral indices, but for this blog post, I will only touch on the following:
Normalized difference vegetation index (NDVI)
Normalized difference water index (NDWI)
Normalized difference building index (NDBI)
Normalized difference moisture index(NDMI)
Soil-adjusted vegetation index (SAVI)
Enhanced vegetation index (EVI)
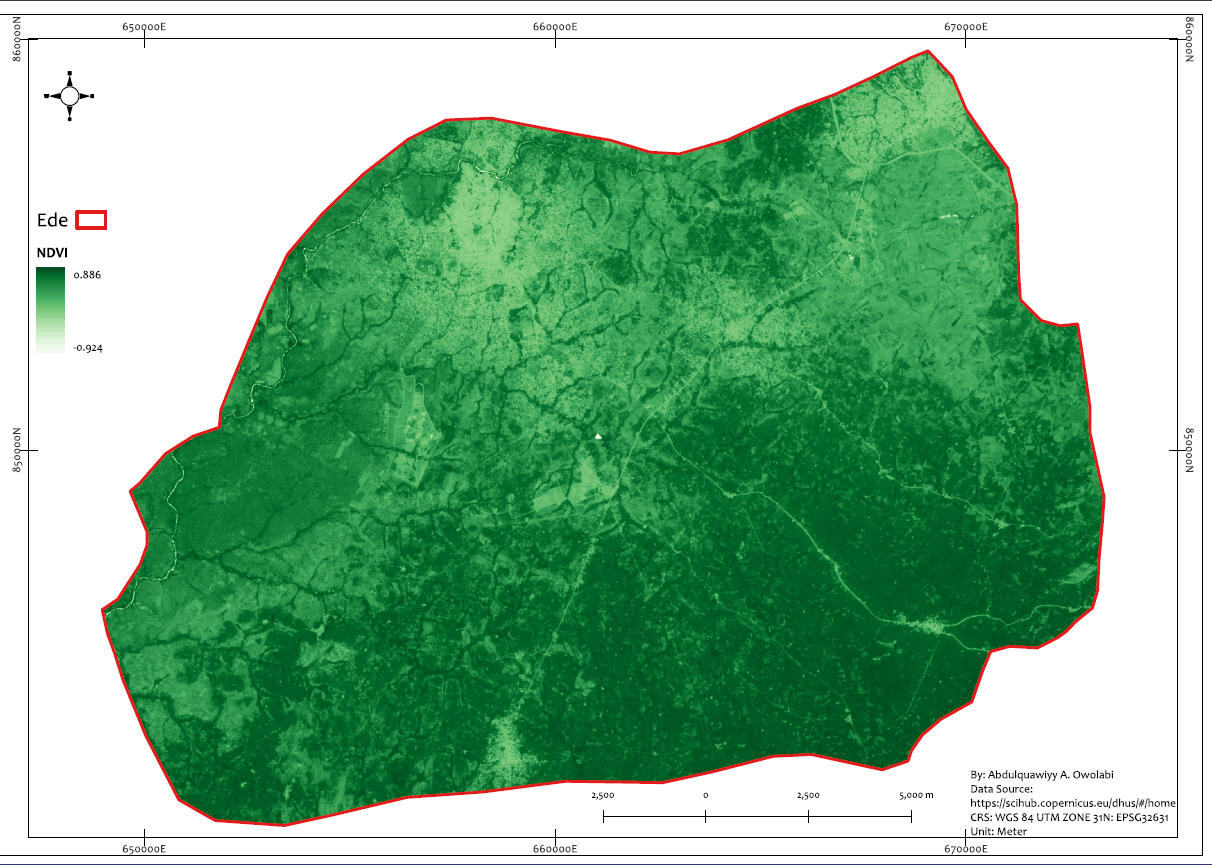
A case was used to explain the implications and application of these indices. The study area used was Ede town, Osun State, Nigeria. This town is located in southwestern Nigeria, and it is characterized by its farm produce such as yam, maize, cassava, etc.
Sentinel 2 is a satellite mission developed by the European Space Agency (ESA) as part of the Copernicus program. This satellite was used for the calculation of these indices. The following bands of the Sentinel 2 satellite (with their basic information) were used:
Blue (B2): wavelength of 490 nm and bandwidth of 65 nm It is useful for distinguishing between water and vegetation.
Green (B3): with a wavelength of 560 nm and a bandwidth of 35 nm, it is useful for vegetation monitoring.
Red (B4): with a wavelength of 655 nm and a bandwidth of 30 nm, it is useful for vegetation monitoring.
Near-infrared (NIR): with a wavelength of 842 nm and a bandwidth of 115 nm, it is useful for vegetation monitoring and land classification.
Short-Wave Infrared 1 (B11): with a wavelength of 1610 nm and a bandwidth of 90 nm, it is useful for mapping features.
Short-Wave Infrared 2 (B12): with a wavelength of 2190 nm and a bandwidth of 180 nm, it is useful for vegetation monitoring.

These downloaded sets of bands were preprocessed and analyzed using the semi-automatic plugin (SCP) and a raster calculator, respectively, in QGIS software. Basically, the preprocessing steps were the clipping of each band to the study area boundary and the conversion of the radiance values to reflectance because it normalized the measure of the amount of light reflected by the Earth’s surface.
How Spectral Indices Work with a Case Study
After the preprocessing (conversion to reflectance and clipping to the boundary extent), the calculations were performed with the bands to give a particular index. The result of each index is also given below:
NDVI is used to quantify vegetation greenness and is useful in understanding vegetation density and assessing changes in plant health. (source: USGS).
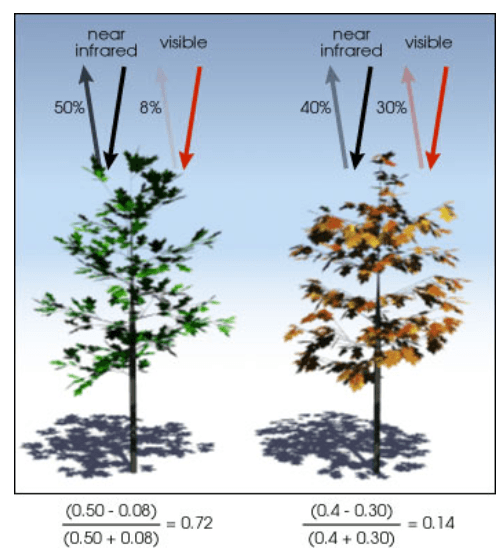
NDVI is calculated from the visible and near-infrared light reflected by vegetation. Healthy vegetation (left) absorbs most of the visible light that hits it and reflects a large portion of the near-infrared light. Unhealthy or sparse vegetation (right) reflects more visible light and less near-infrared light.
NDVI = (NIR — R)/(NIR + R)
Where:
NIR = pixel values from the near-infrared band
Red = pixel values from the red band
NDVI for a given pixel always results in a number that ranges from minus one (-1) to plus one (+1); however, no green leaf gives a value close to zero. A zero means no vegetation, and close to +1 (0.8–0.9) indicates the highest possible density of green leaves (Earth Observatory Article).
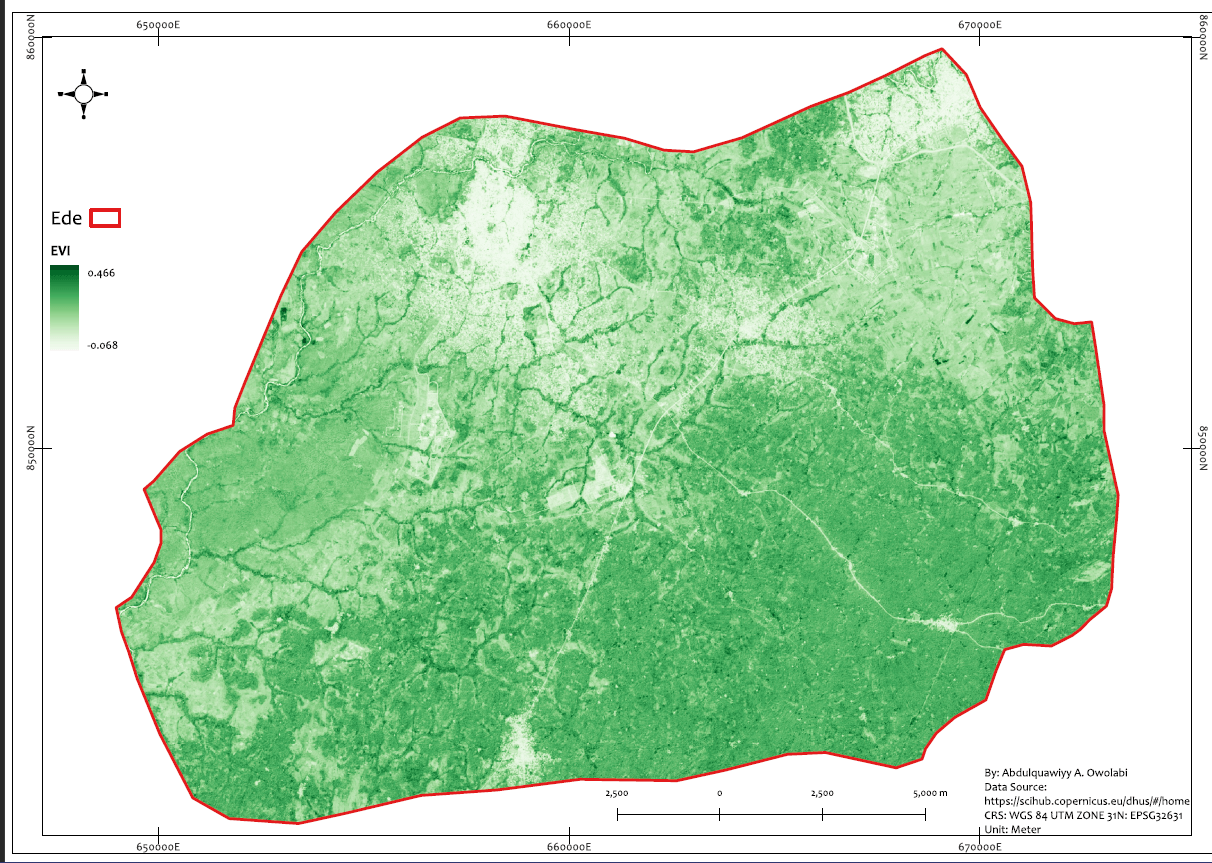
Enhanced Vegetation Index (EVI): this is an enhanced vegetation indexused to enhance the vegetation with improved sensitivity in high biomass regions and improved vegetation monitoring through a decoupling of the canopy background signal and a reduction in atmospheric influences. It is computed as
source: A Huete et al
The coefficients adopted in the MODIS-EVI algorithm are L = 1, C1 = 6, C2 = 7.5, and G = 2.5.
EVI has a value range of -1 to +1, and it ranges between 0.2 and 0.8 for healthy vegetation. EVI incorporates coefficients C1 and C2 to account for atmospheric aerosol scattering, as well as L to adjust for soil and canopy background.
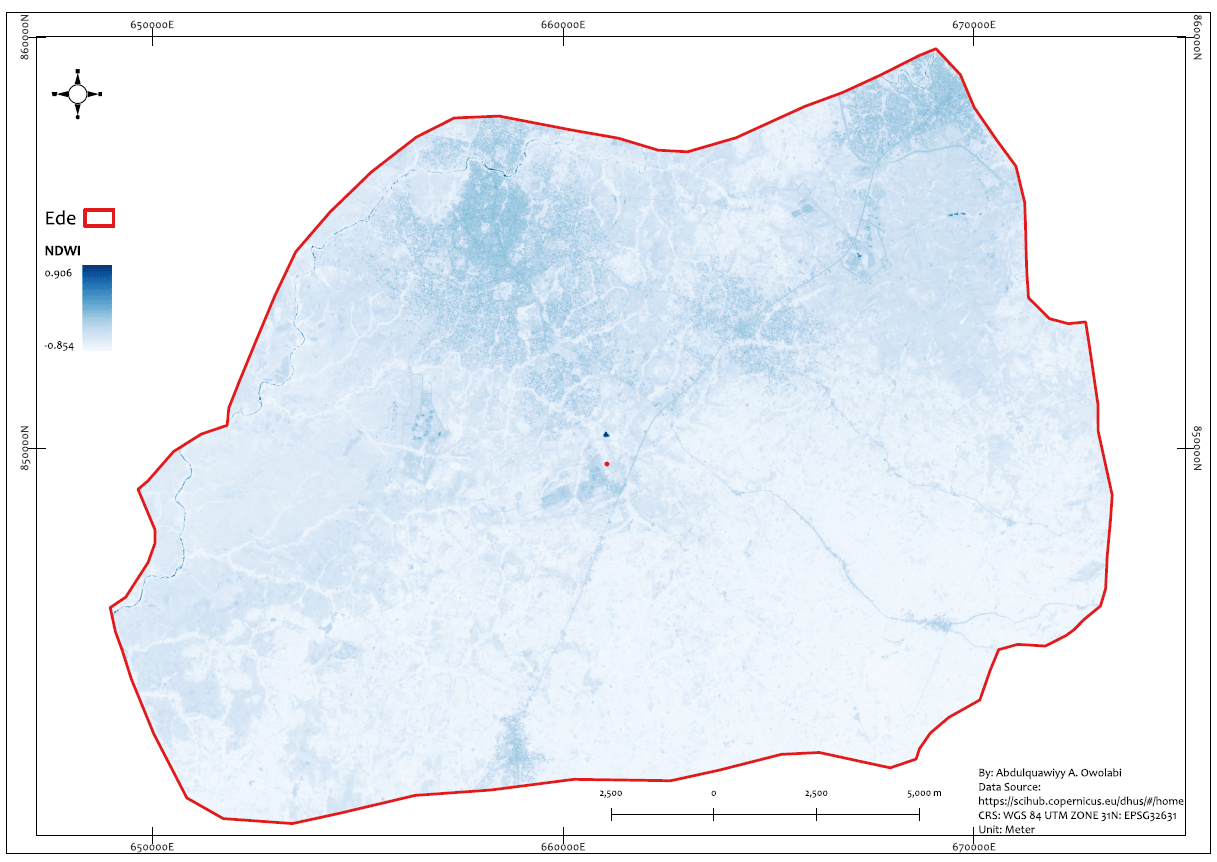
The NDWI is a remote sensing-based indicator sensitive to the change in the water content of leaves (Gao, 1996). NDWI is computed using the near-infrared (NIR ) and the short-wave1 infrared (SWIR) reflectance
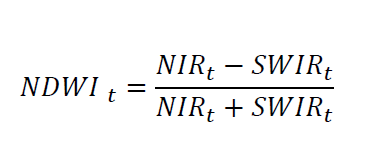
Where:
NIR = pixel values from the near-infrared band
SWIR= pixel values from the short wavelength infrared band
NDWI values range from 1 to -1, where values less than 0.3 are non-water and values greater than or equal to 0.3 are water.
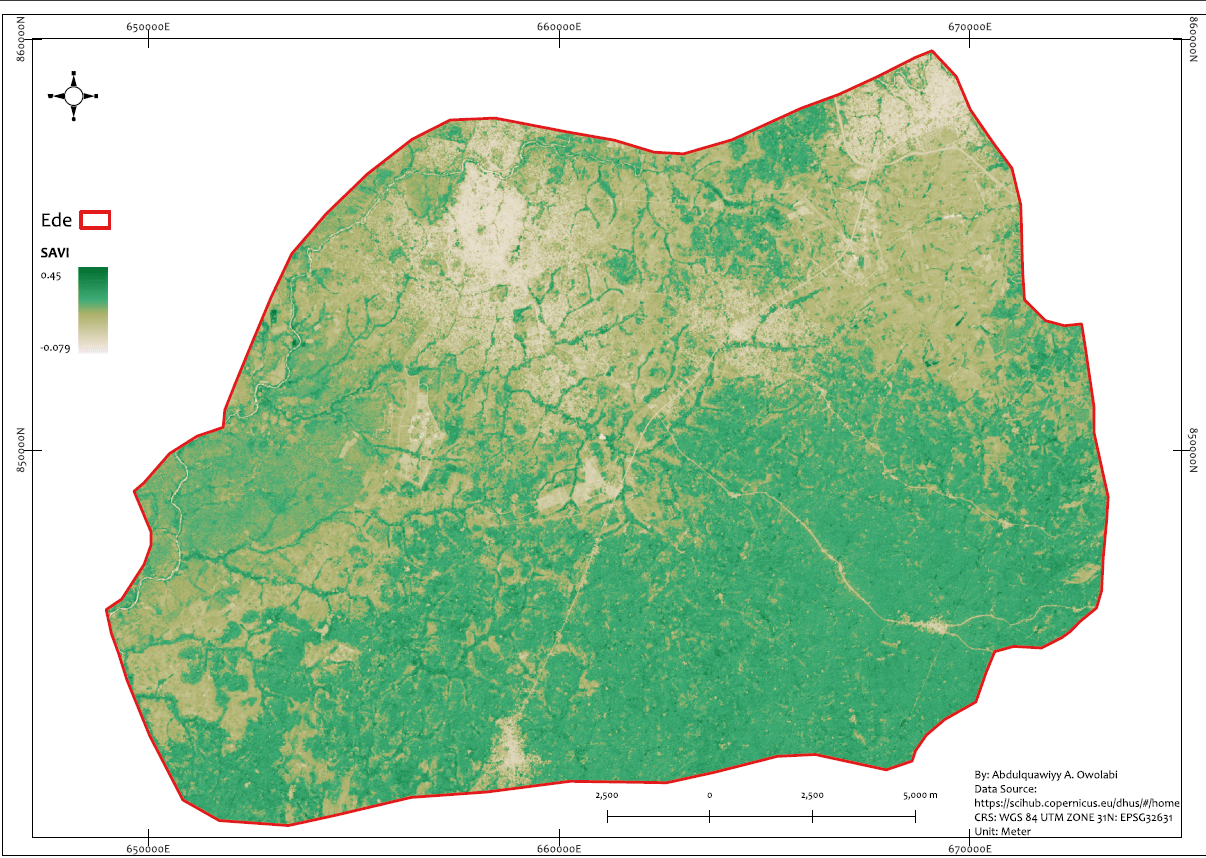
SAVI (Soil-Adjusted Vegetation Index) was developed to account for the differential red and near-infrared extinction through the vegetation canopy. The index is a transformation technique that minimizes soil brightness influences from spectral vegetation indices involving red and near-infrared (NIR) wavelengths (Huete, 1988). The index is given as:
Where:
NIR = pixel values from the near-infrared band
Red = pixel values from the red band
L = amount of green vegetation cover
This index outputs values between -1.0 and 1.0.
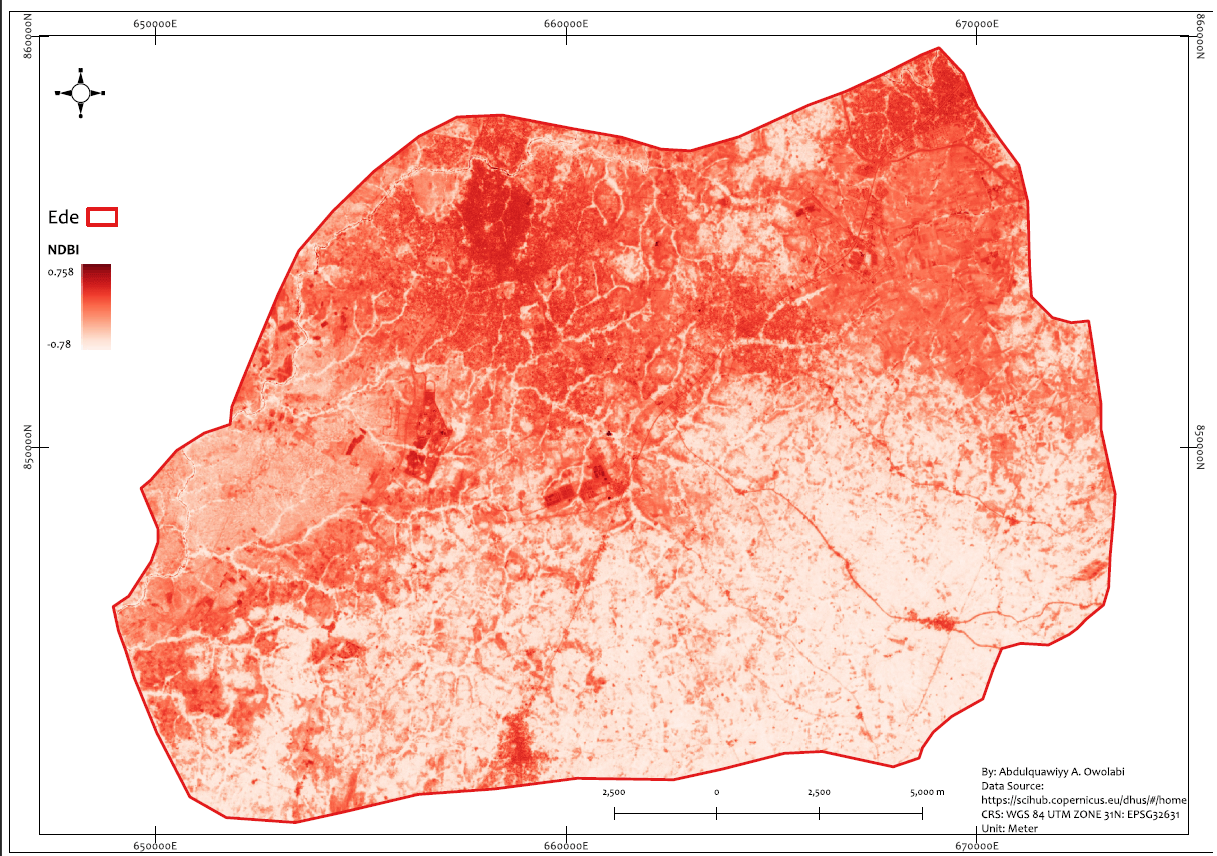
The NDBI (normalized difference build-up index) is used to emphasize build-up areas. Its value lies between -1 to +1. A negative value of NDBI represents water bodies, whereas the higher value represents build-up areas. NDBI value for vegetation is low. The index is given as

where:
SWIR= pixel values from the short wavelength-infrared band
NIR= pixel values from the near-infrared band
References:
A.R Huete: A soil-adjusted vegetation index (SAVI).
Gao, B.C. (1996), “NDWI: A Normalized Difference Water Index for Remote Sensing of Vegetation Liquid Water from Space.”
Introduction to Remote Sensing
Kasulla, Srinivas. (2022). Re: How can I interpret enhanced vegetation index values? Retrieved from: (Research Gate)
Landsat Normalized Difference Vegetation Index
Multispectral Instrument (MSI) Overview.
Remote Sensing of EnvironmentVolume 58, Issue 3, December 1996, Pages 257–266.Stuart K. McFeeters: Using the Normalized Difference Water Index (NDWI) within a Geographic Information System to Detect Swimming Pools for Mosquito Abatement: A Practical Approach