
.jpg&w=3840&q=100)
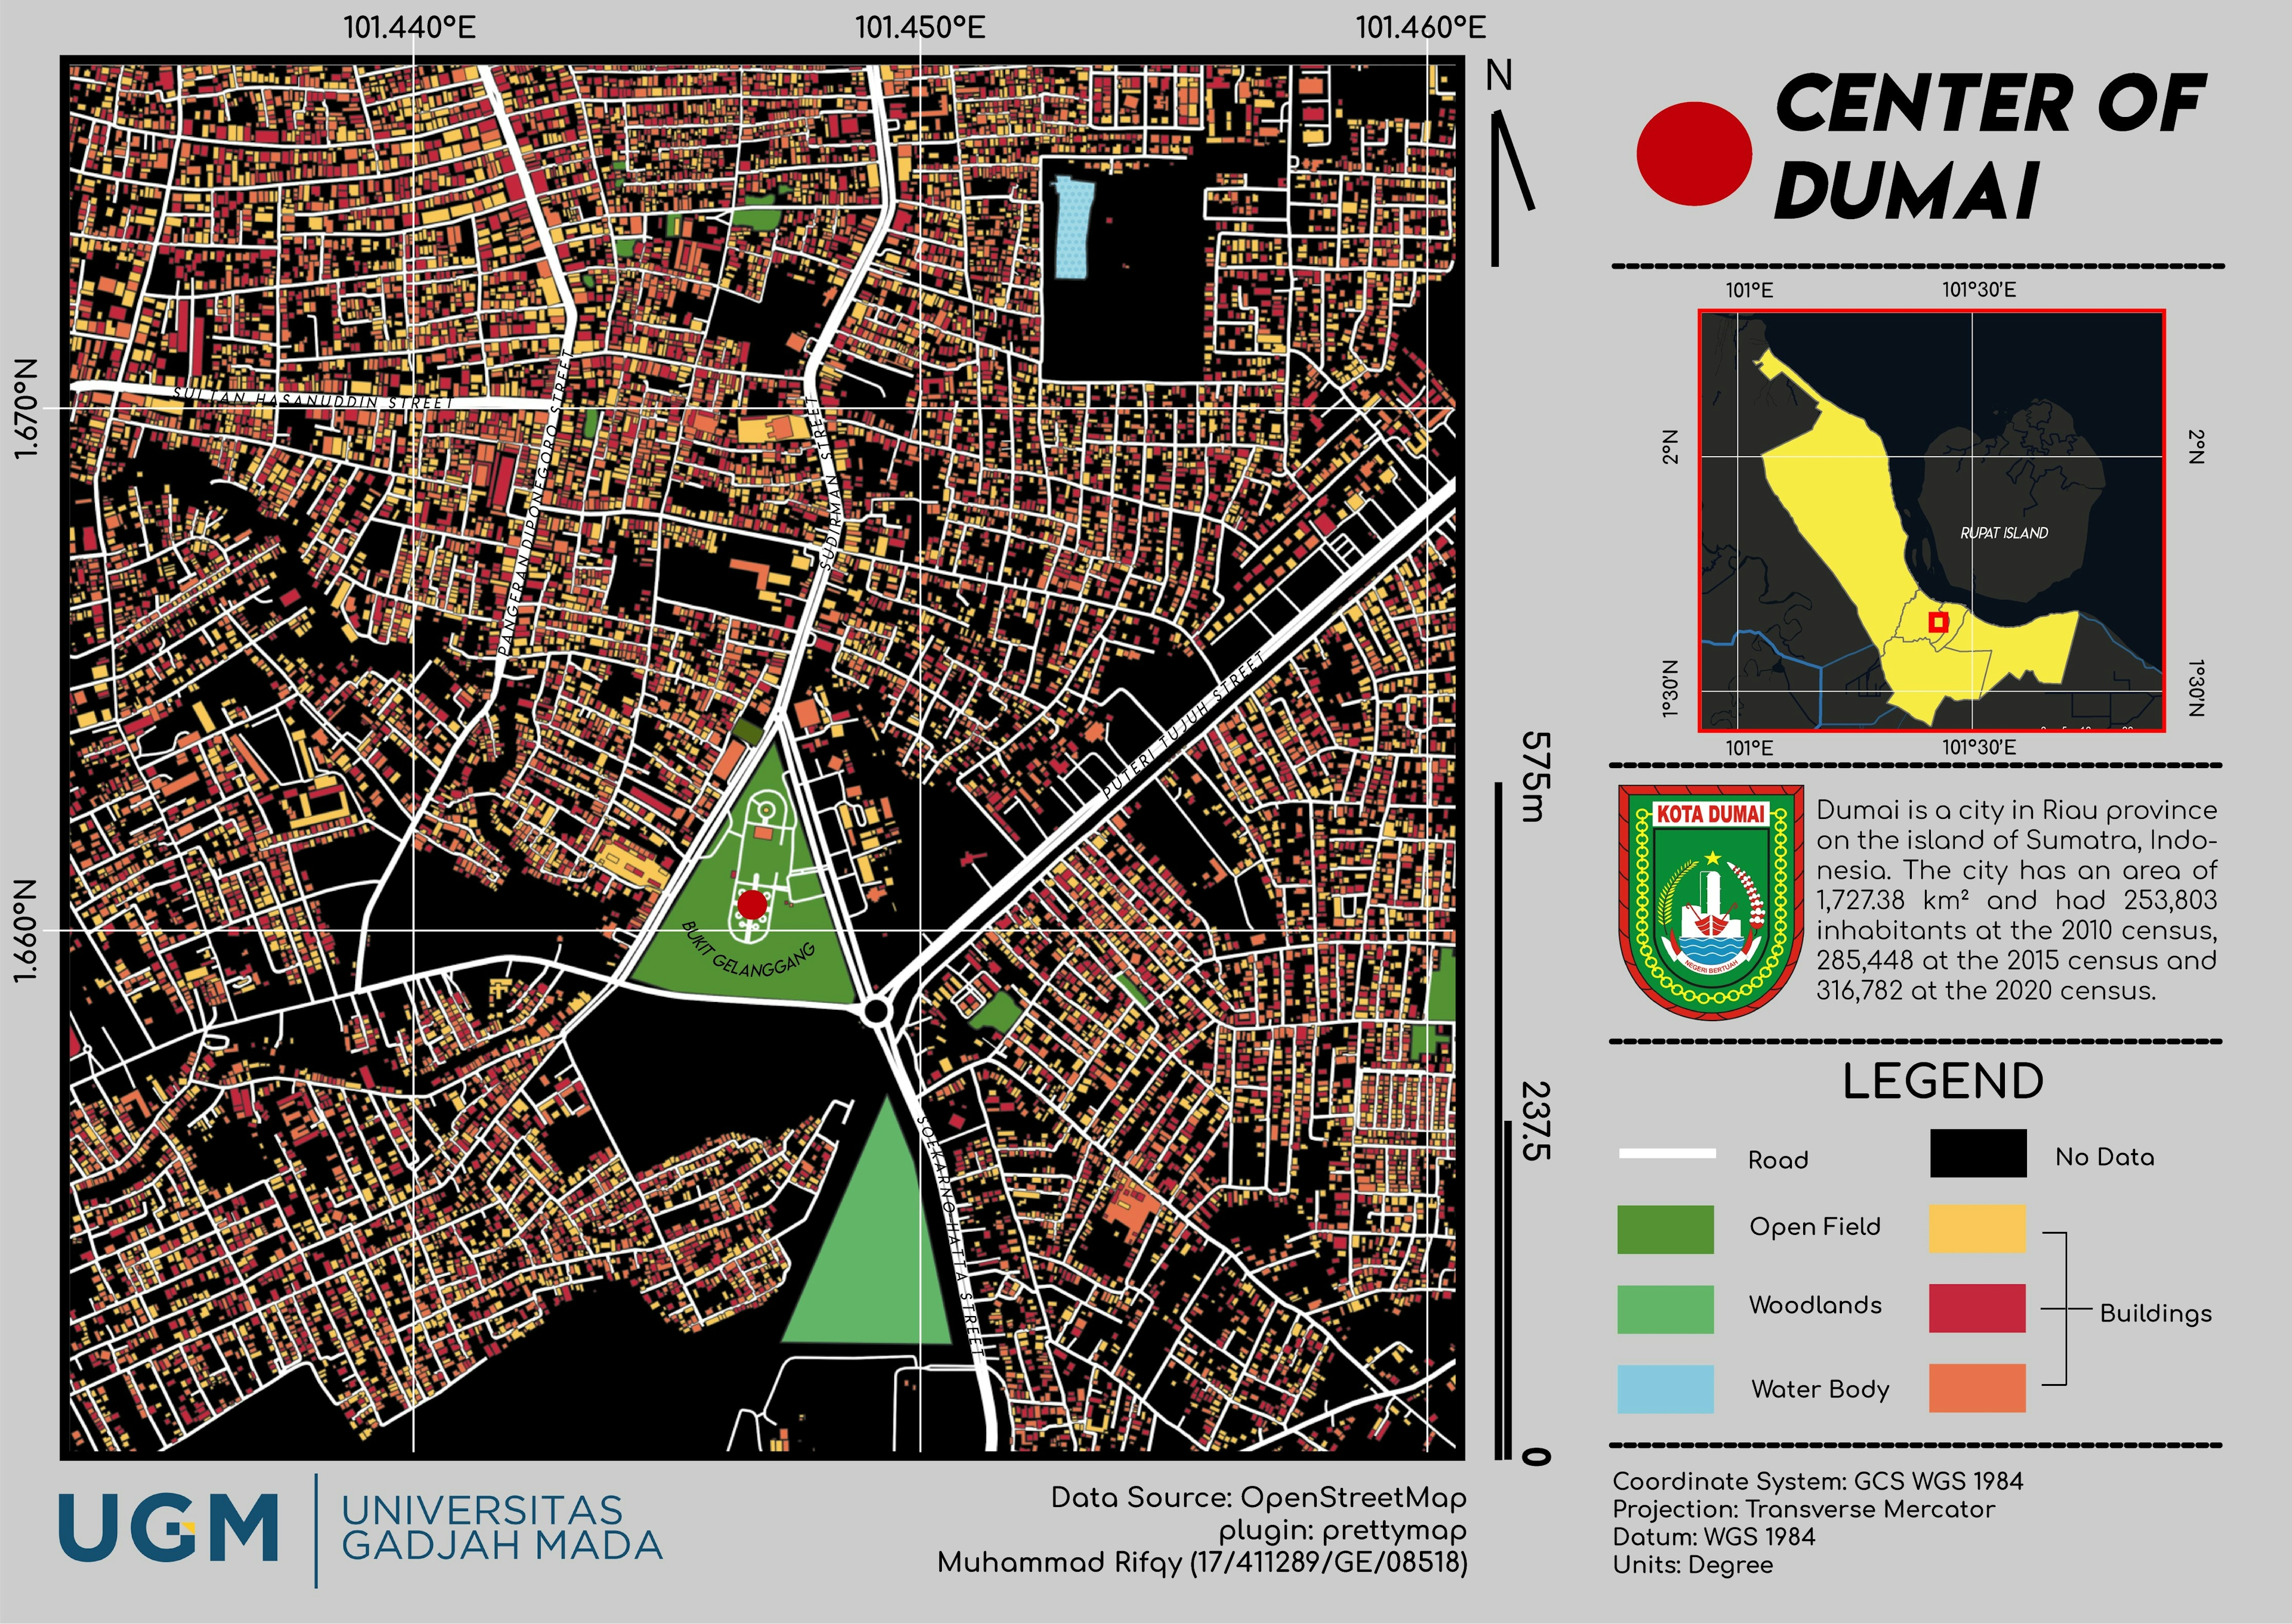
This project visualized a GPS dataset, specifically different interval resolutions, within an urban setting. This test took place on UNC Charlotte's main campus, with 1 second, 5 second and 15 second interval resolutions. The data set was extracted and visualized using ArcGIS pro to visualize how different resolutions are tracked for commuters on UNC Charlotte's campus.
GPS Interval Dataset visualization
Plug-ins used
SQL
tags
Data ManagementGPS


You might also like


.svg "Keran Nkongolo")


Join the community!
We're a place where geospatial professionals showcase their works and discover opportunities.