During my participation in the MIT Summer School at the Senseable Amsterdam Lab, I embarked on a transformative journey that allowed me to delve into the intricate world of environmental science and urban sustainability. This project encapsulated a diverse range of activities and research endeavors, all aimed at comprehending the complexities of our urban environments and contributing to a more sustainable future.
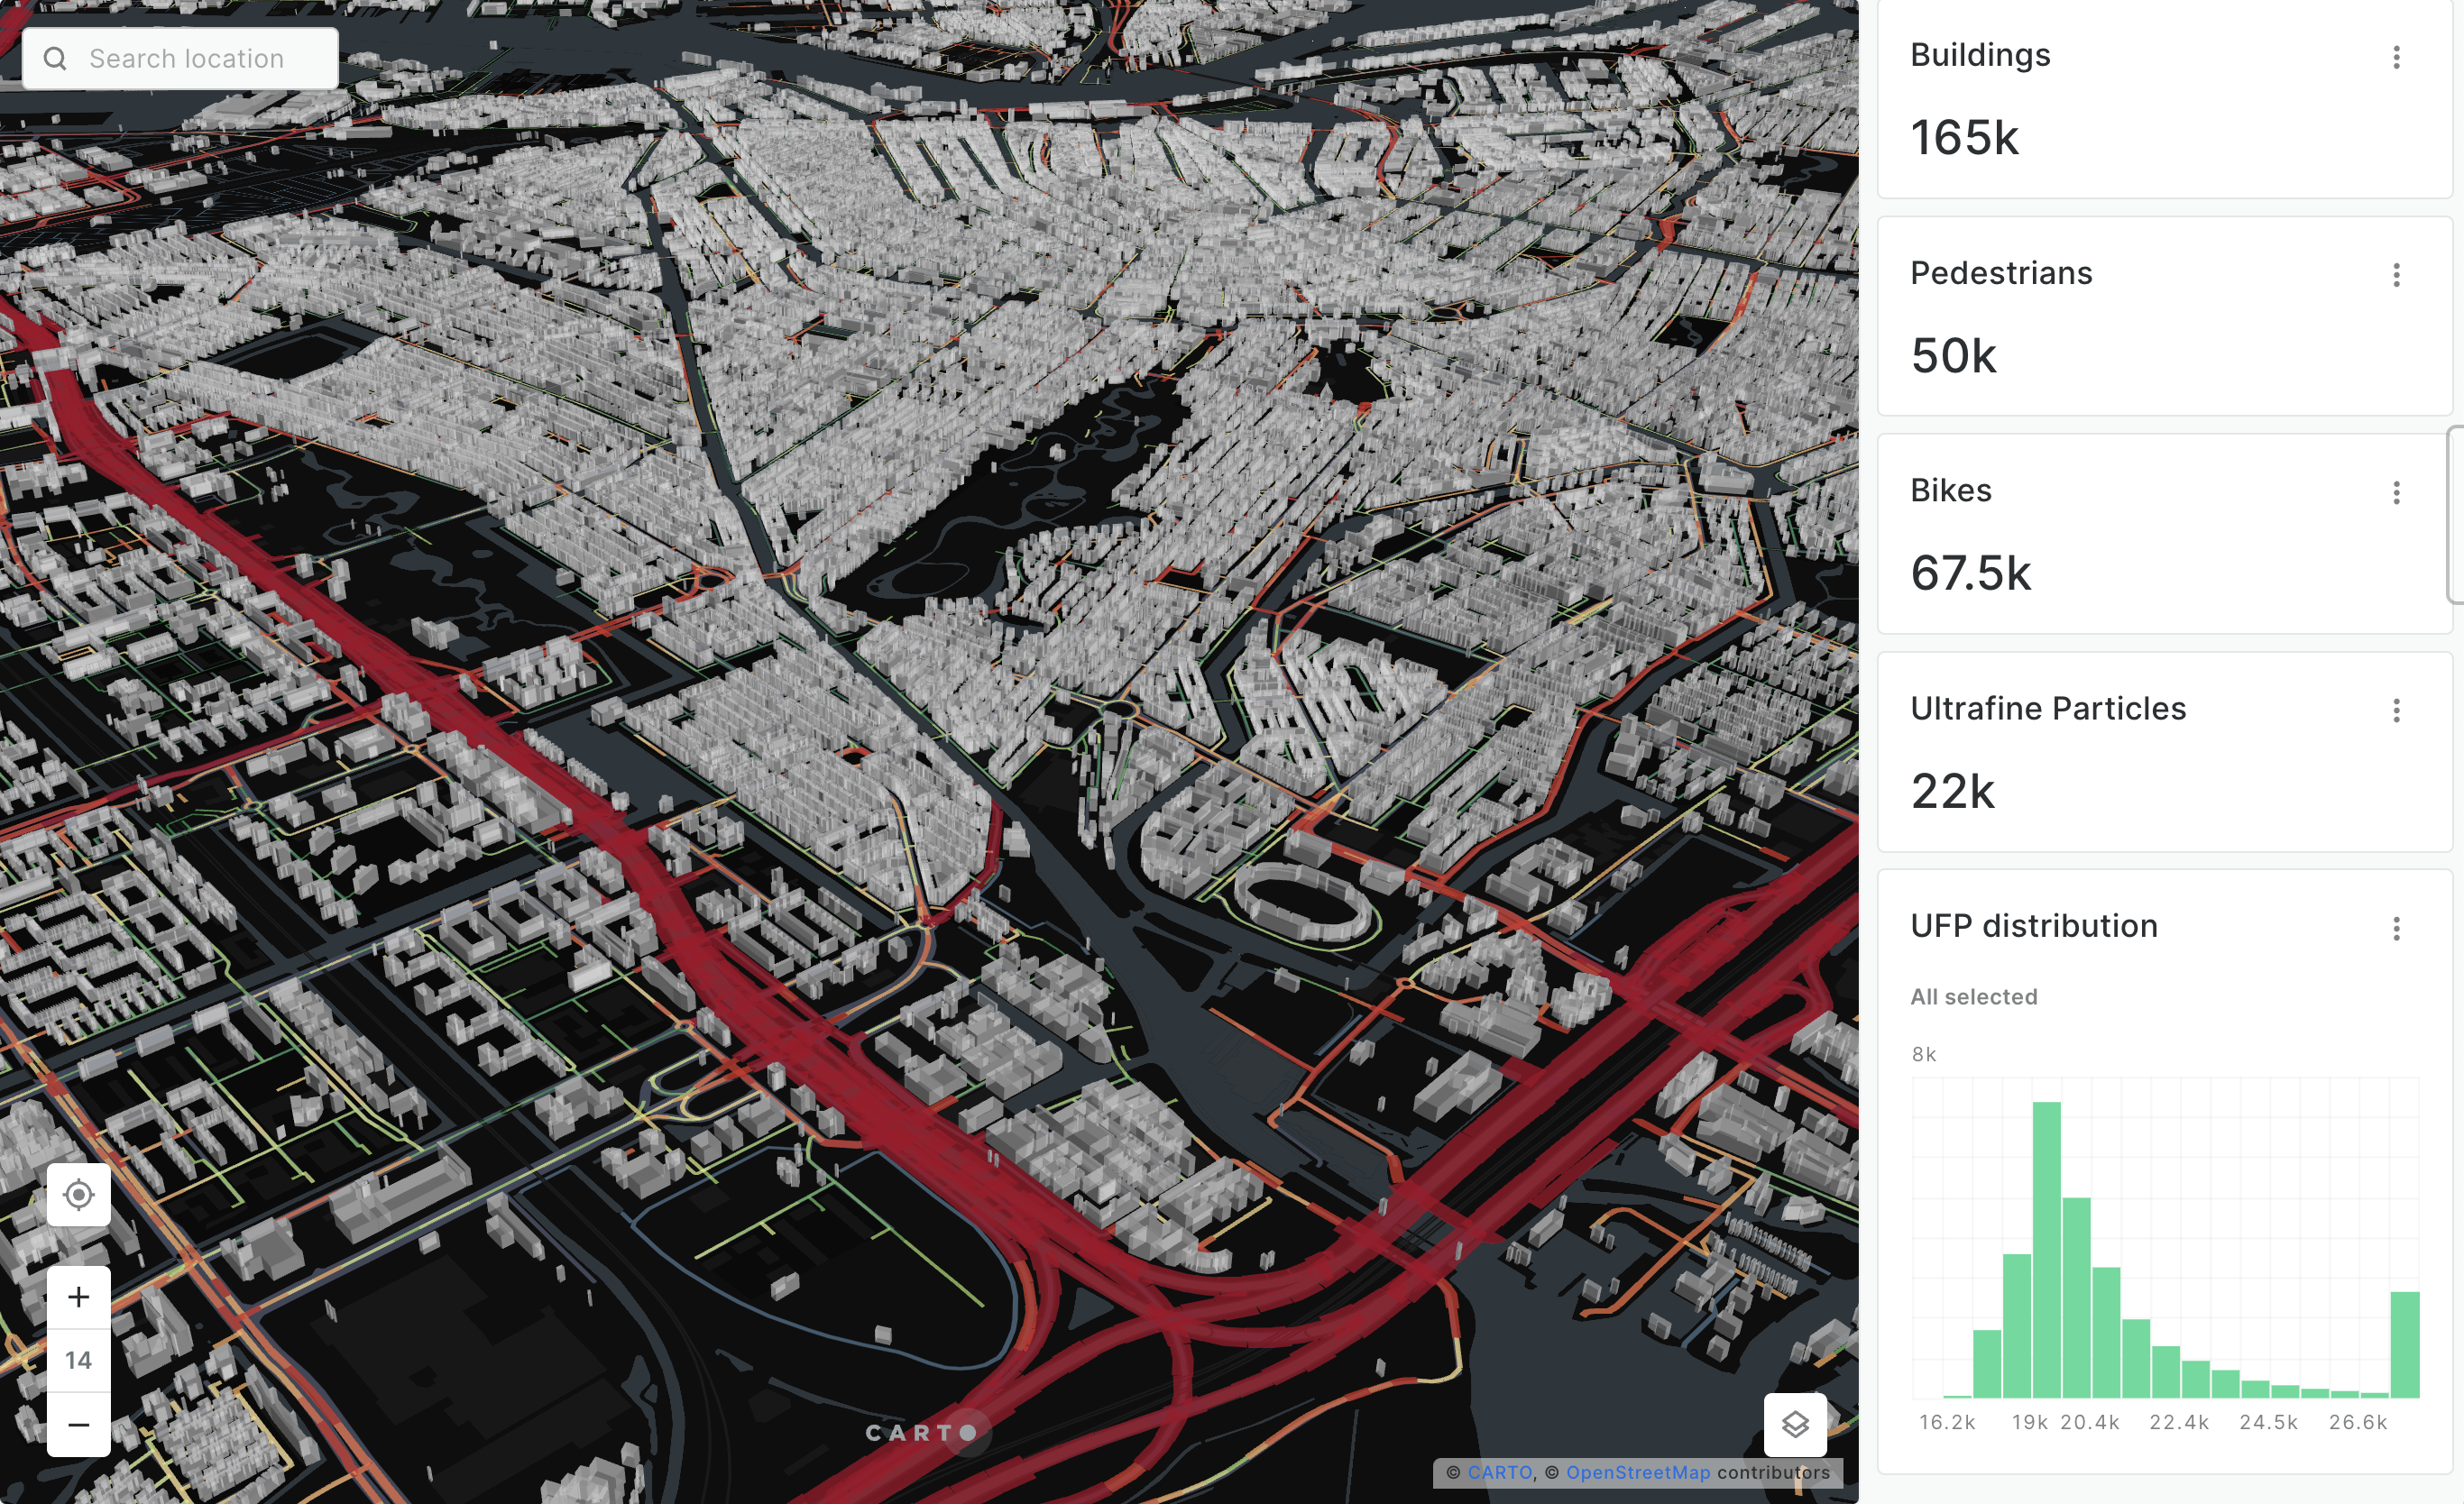
To visualize the real impact of our work in Amsterdam's urban environment, I invite you to explore our interactive air quality map. This map provides a dynamic and informative display of high-resolution air quality data, including concentrations of key pollutants such as NO2, Black Carbon and Ultrafine Particles on a street-by-street basis. By navigating this interactive map, you can gain a first-hand understanding of how our data-driven insights have illuminated the nuances of air quality within the city. This tool not only showcases the depth of our research but also underscores the critical importance of informed decision-making in the pursuit of healthier, more sustainable urban spaces. Dive into the map here to witness the environmental impact up close.
Decarbonizing Urban Areas
One of the pivotal aspects of this project was gaining profound insights into strategies for decarbonizing urban areas. Understanding how to reduce carbon emissions within cities is a paramount challenge in the battle against climate change, and this knowledge has equipped me with innovative ideas for urban planning and policy development.
Social Consequences of Climate Change
The project extended its reach to explore the social consequences of climate change. It was eye-opening to witness how environmental shifts impact the lives of individuals and communities. This exploration emphasized the importance of addressing environmental justice and public health concerns, motivating me to seek solutions that prioritize the well-being of all.
Air Quality Data Collection and Analysis
Hands-on experience played a significant role in this project. I actively participated in constructing a Flatburn device outfitted with sensors for the purpose of collecting air quality data in Amsterdam. This data collection was augmented by the utilization of high-resolution air quality maps derived from street-by-street measurements using Google Street View cars. The combination of empirical models and mixed model frameworks allowed us to predict air pollutant concentrations with unparalleled precision.
UltraFine Particle Composition Analysis
The project also delved into the microscopic world of UltraFine Particles in Amsterdam's air. By analyzing their composition, I gained valuable insights into the sources and types of air pollutants within the city. This knowledge forms the foundation for informed decision-making in air quality management and mitigation efforts.
Human Exposure Assessment
Using cutting-edge computer vision techniques and data from Street View, I undertook a comprehensive assessment of human exposure to air pollutants. This approach identified areas in Amsterdam with high pedestrian traffic, shedding light on locations where individuals are most vulnerable to air pollution.
This project embodies my commitment to environmental stewardship and urban sustainability. It has equipped me with a diverse skill set, including data analysis, sensor technology, and the ability to bridge the gap between environmental science and societal well-being.


.jpg&w=3840&q=100)