

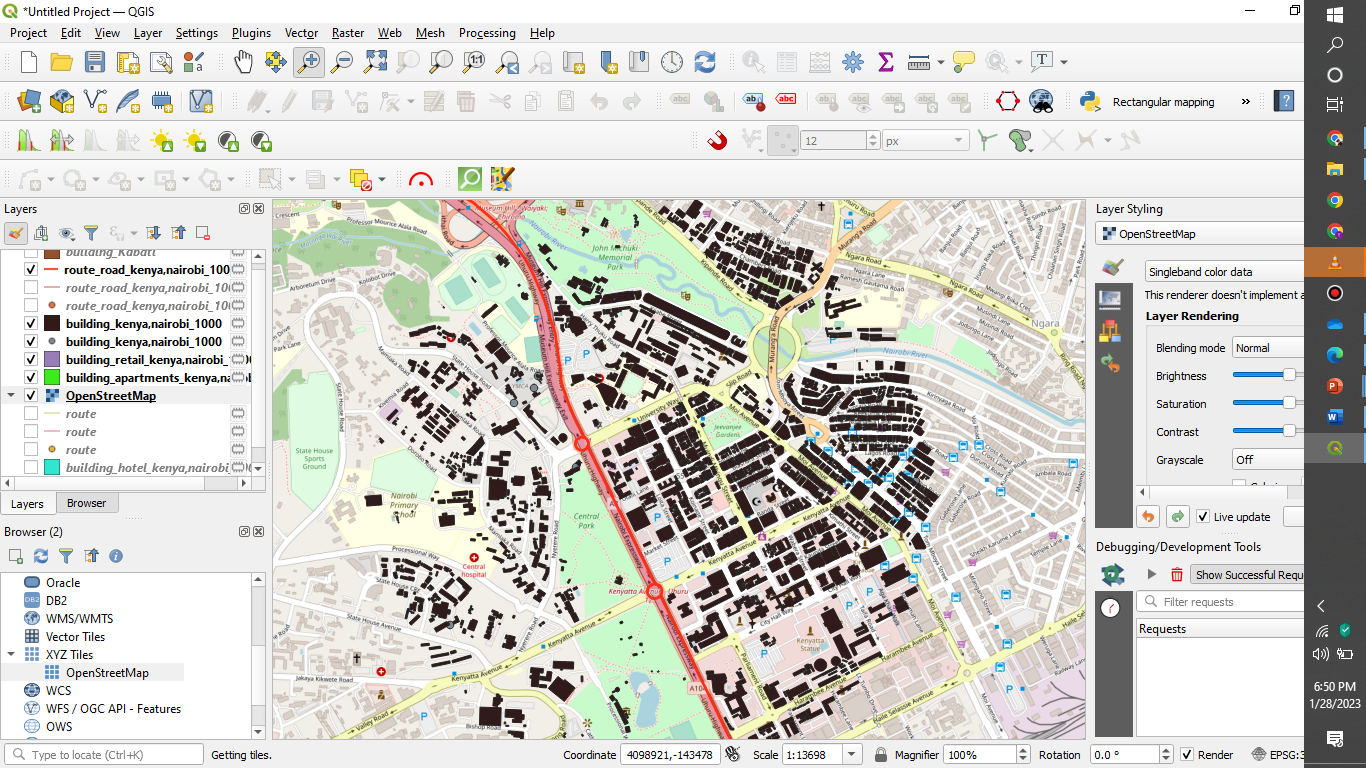
This map displays the East Coast region of Guyana, highlighting Georgetown—the capital—and its surrounding areas. The visualization was created in QGIS using OpenStreetMap (OSM) data. Building footprints are represented as orange polygons, waterways as blue line features, and farmlands as green polygons.
The map illustrates the spatial distribution of urban and agricultural land uses within the coastal plain, where much of the built environment—including residential, commercial, and institutional structures—lies below sea level. This region faces increasing vulnerability to sea level rise and coastal flooding, underscoring the need for resilient urban and environmental planning strategies.
This project is part of a larger project I'm completing for a semester long independent study of 3D mapping and climate vulnerability analysis along the coastal region in Guyana.


![Lexical Map of [Shovel] in Malay Lang](/_next/image?url=https%3A%2F%2Fstorage.googleapis.com%2Fspatialnodefiles%2Fprojects%2FPetaDialekCangkul1_9000385.png&w=3840&q=100)


.svg "Keran Nkongolo")