
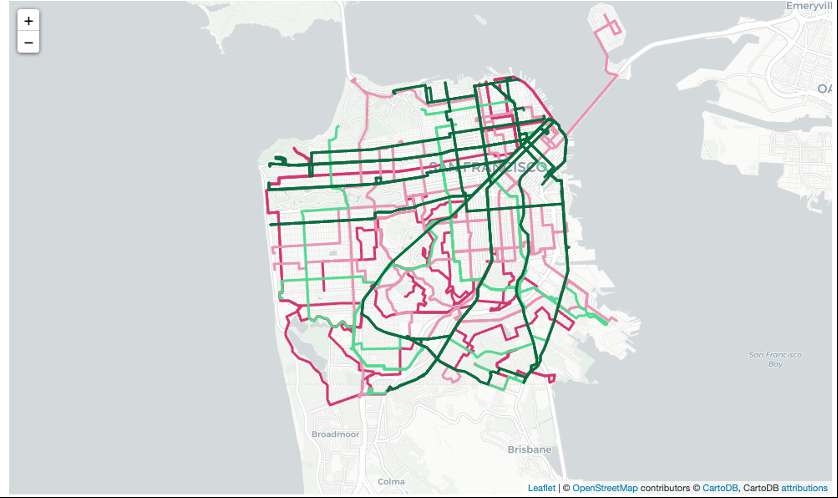
Using GTFS data from San Francisco to plot interactive maps of bus line frequencies with gtfs_funtions package in Python
Transit Line Frequencies
Tools used
Python
Plug-ins used
Carto DBLeafletJSOpenStreetMap
tags
Data Visualization#SpatialNode
More by Bertrand Lobo


You might also like


.svg "Keran Nkongolo")


Join the community!
We're a place where geospatial professionals showcase their works and discover opportunities.