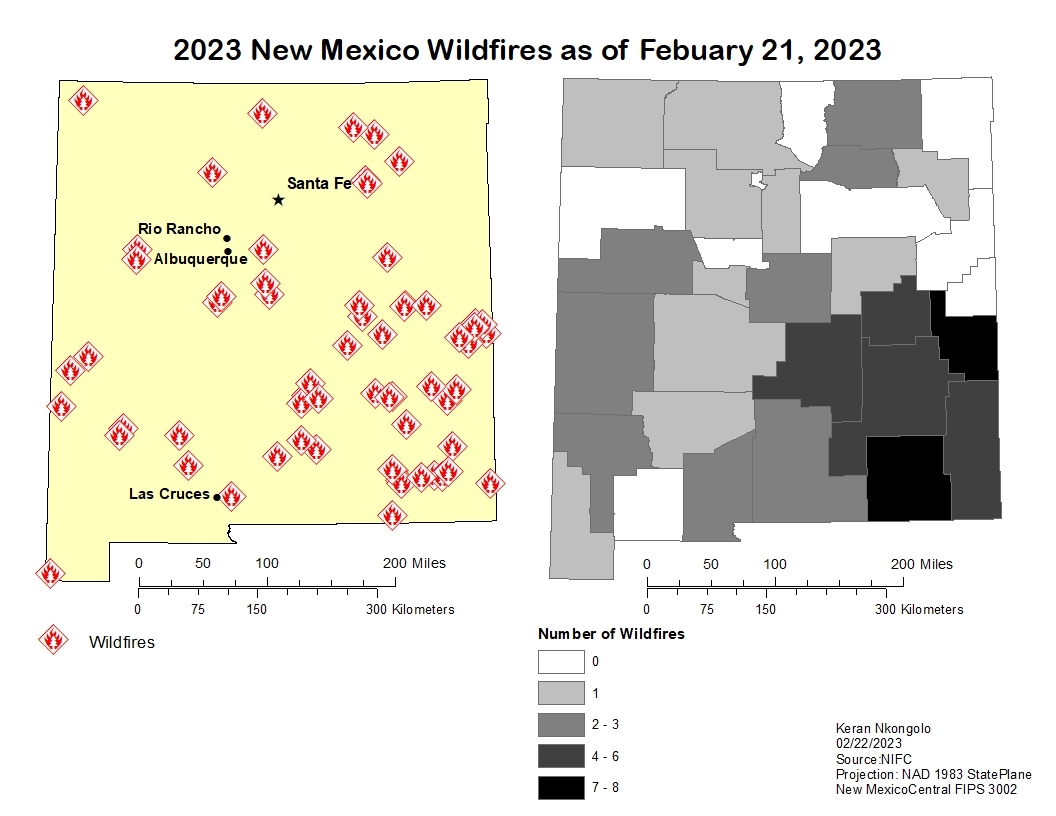
.svg "Keran Nkongolo")


This project is a continuation of the previous project exploring the relationship between total farm income and the number and size of farms in Utah in 2020. An OLS regression was done with the number farms as the explanatory variable and total farm income as the dependent variable, and the results revealed that based the R square .285 or 28 percent of the in the state's total farm income could be explained by the number of farms.
This Geographic Weighted regression investigates the same combination of explanatory and dependent variables, but the model is local rather than a global in the case of the OLS regression. The GWR was run in two sets as the first uses a bandwidth (bw) of 20 counties as this is the area of the local model and based on the map up to 0.77 or 77 percent of the variability in total farm income in the northeast counties can be explained by the number of farms. When the bandwidth was 28 which is all the counties in the state up to 0.64 or 64 percent of the variability of total farm income in northeast counties can be explained by the number of farms. In both models very little of the variability of total farm income could be explained by number of farms in the southwest and southeast portion of that state.