

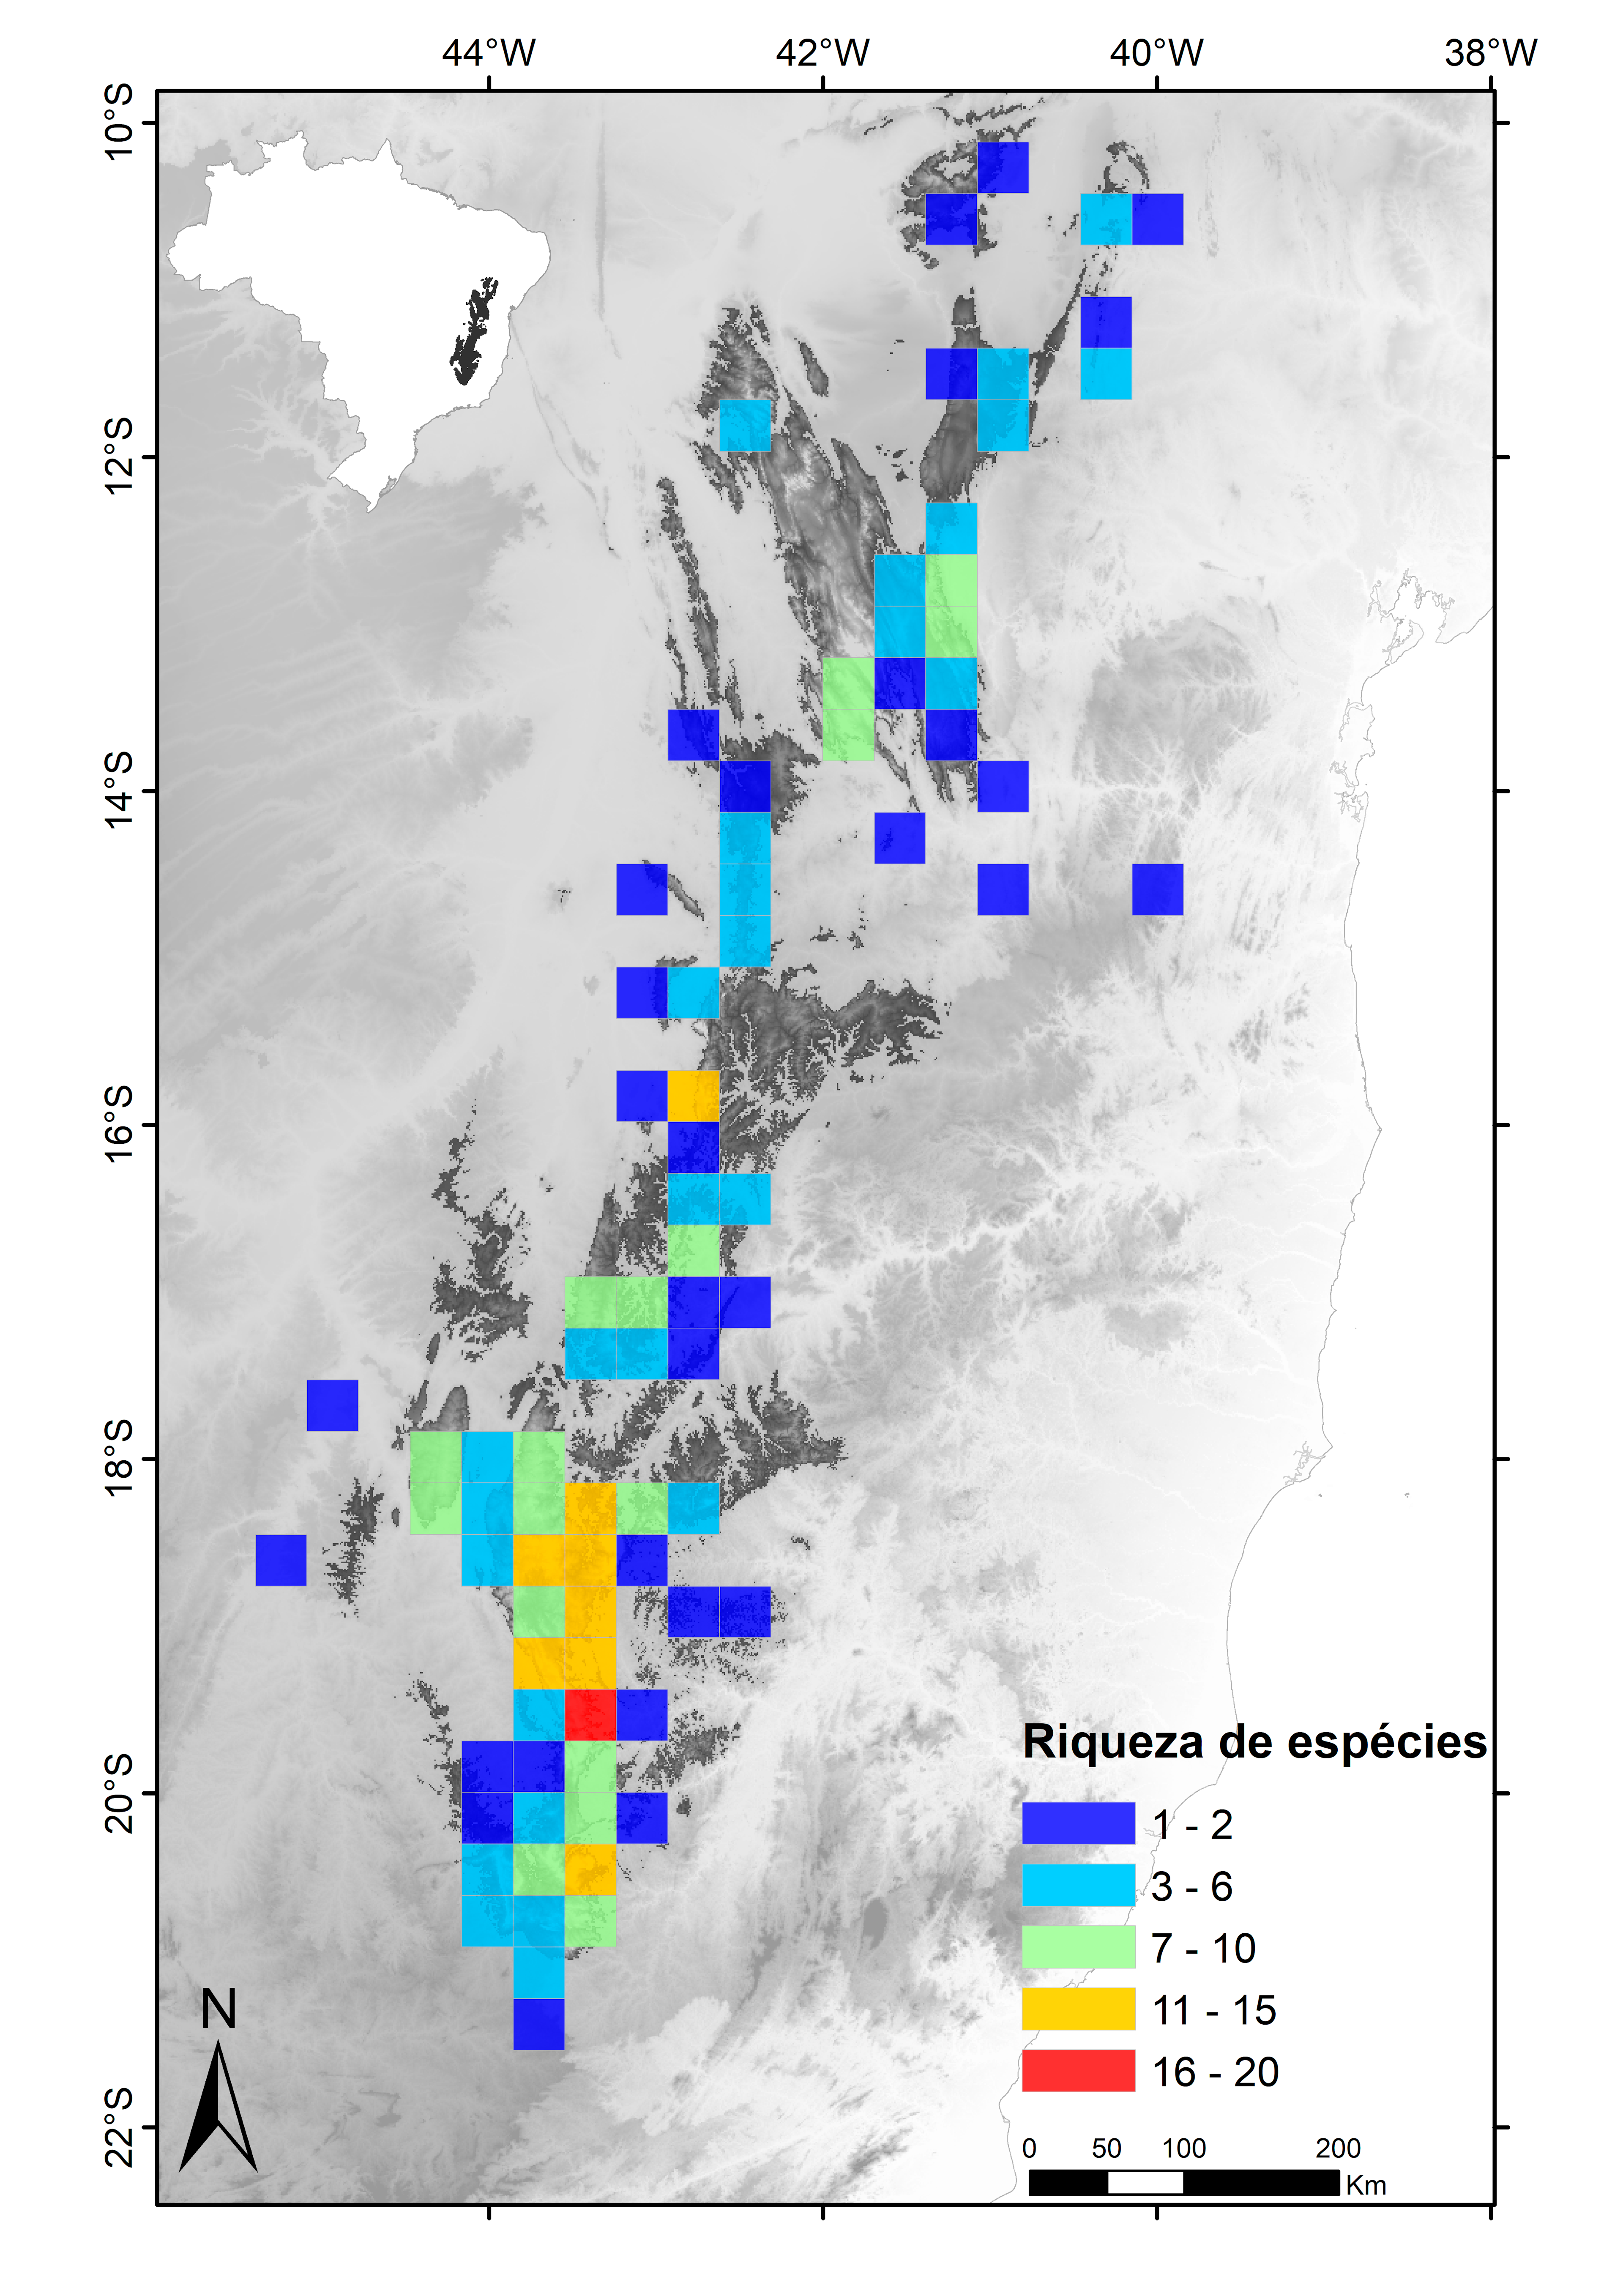
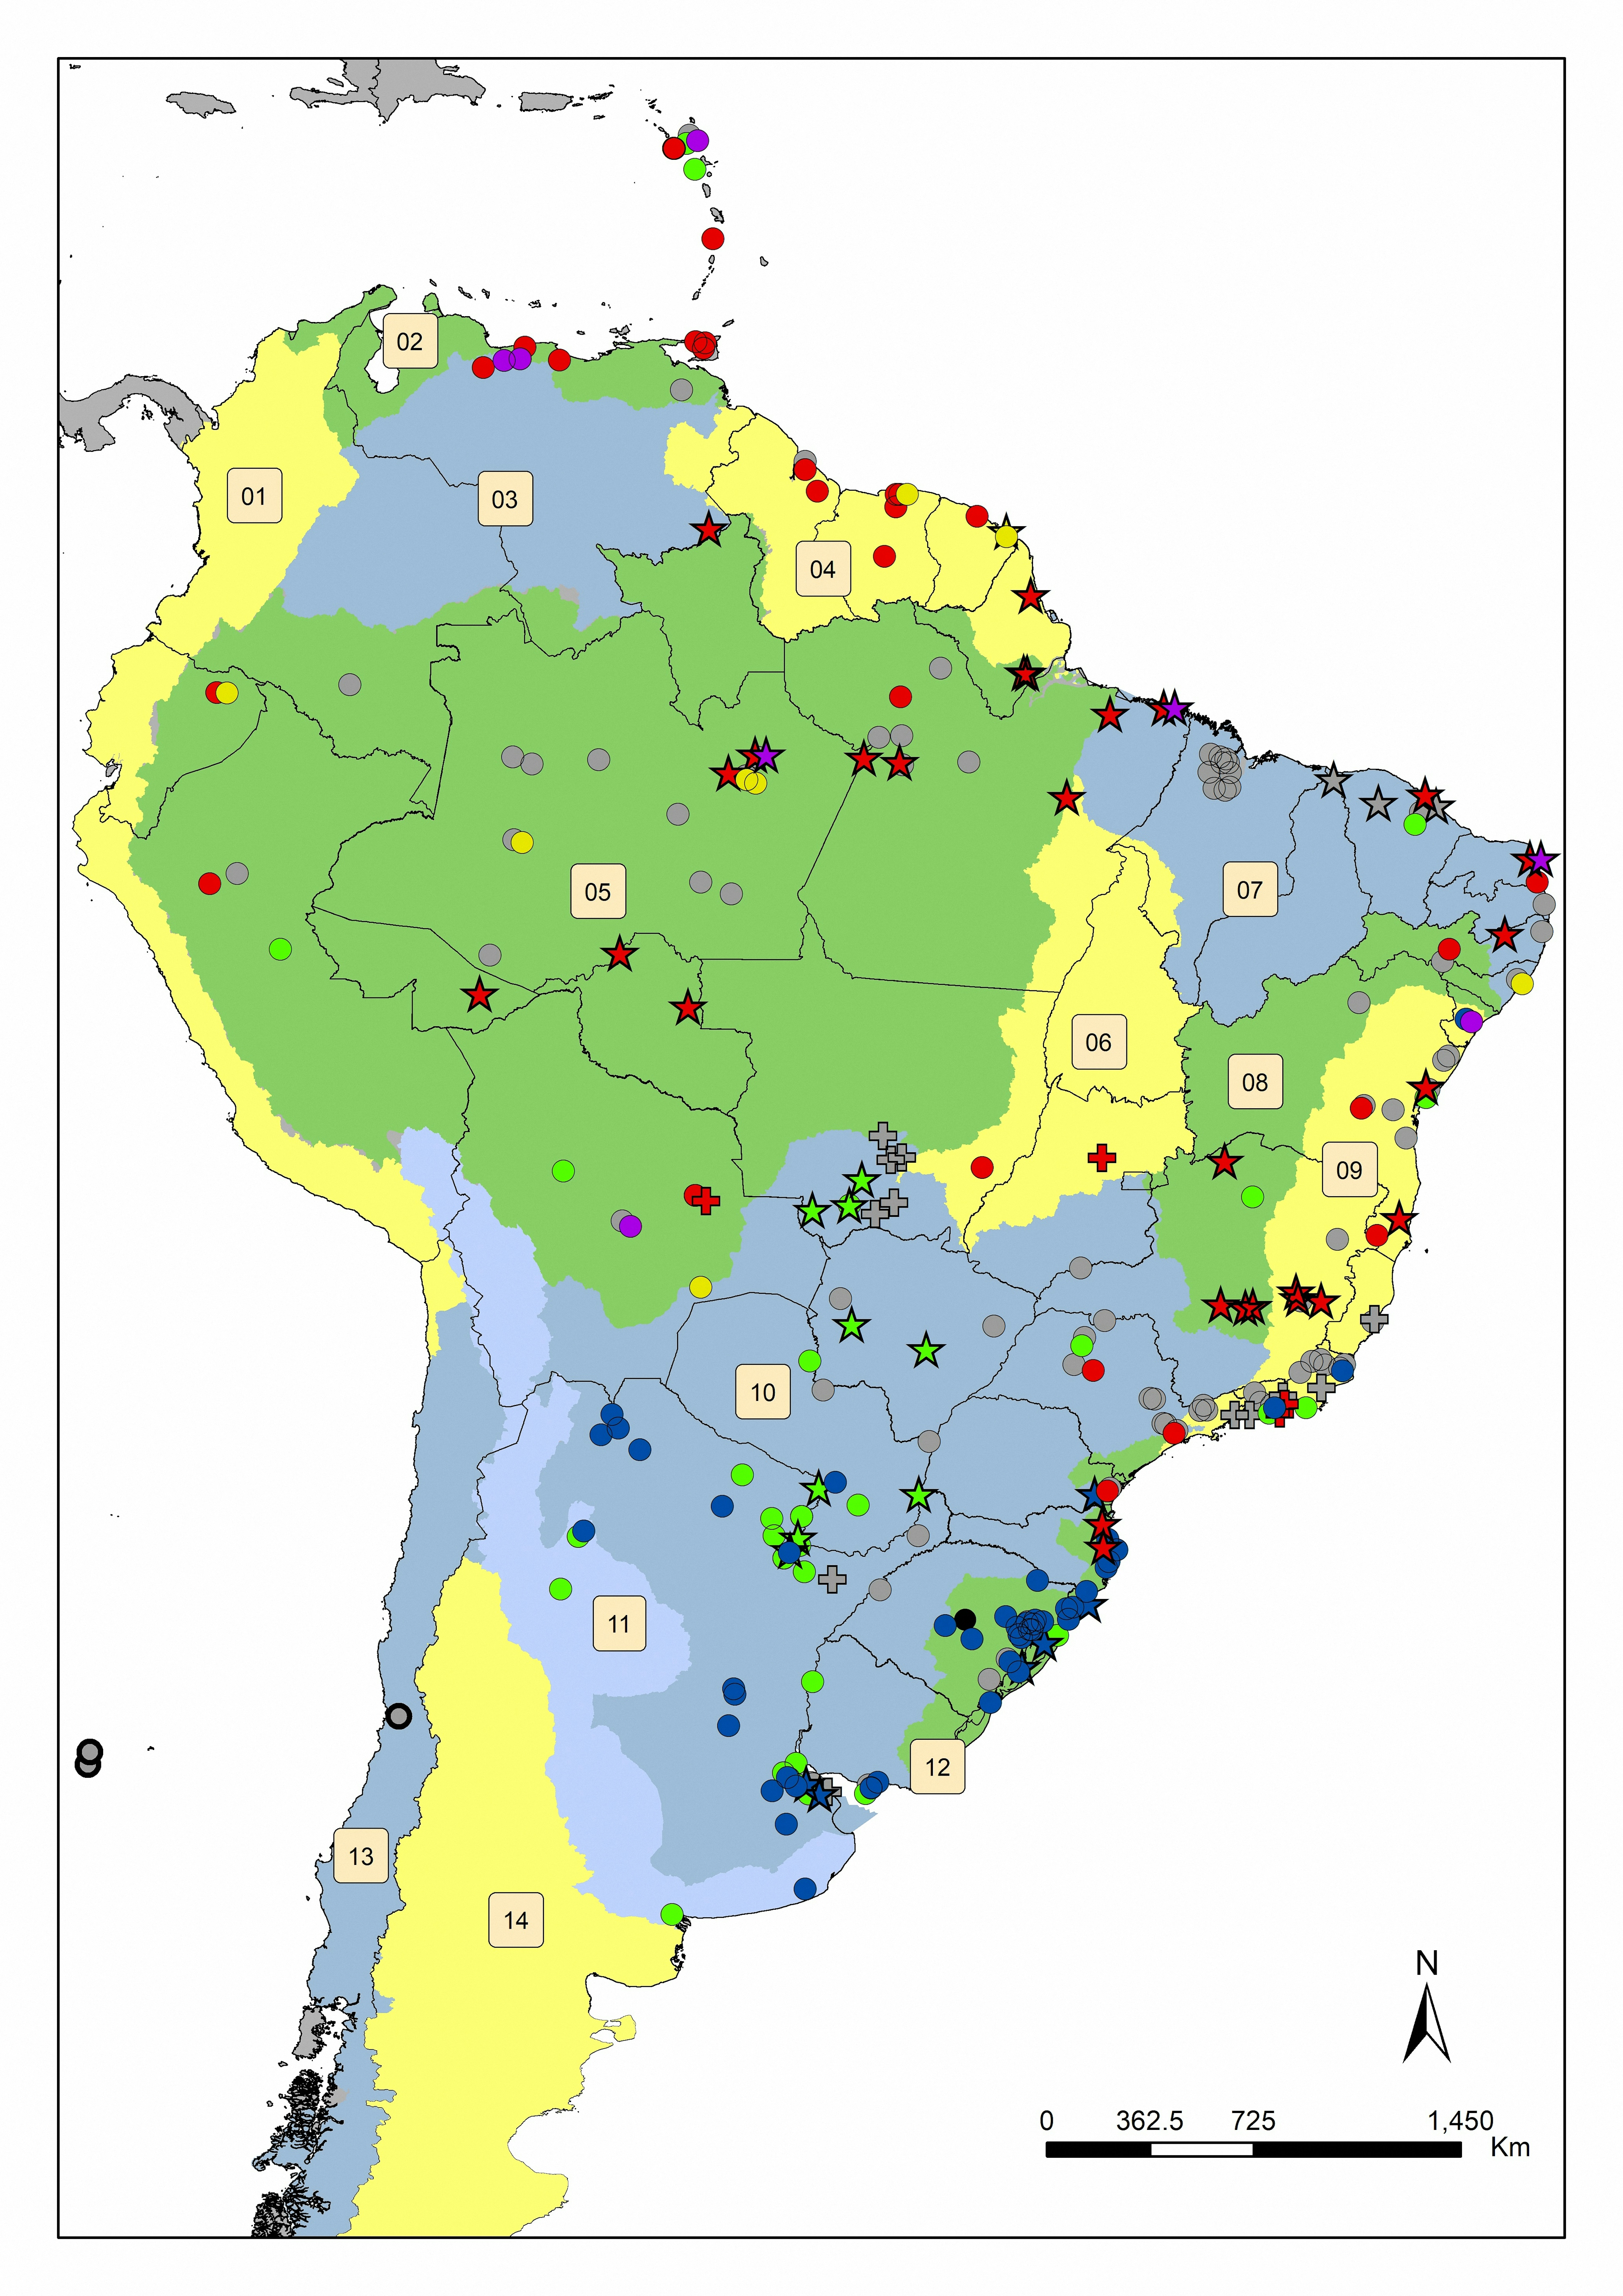
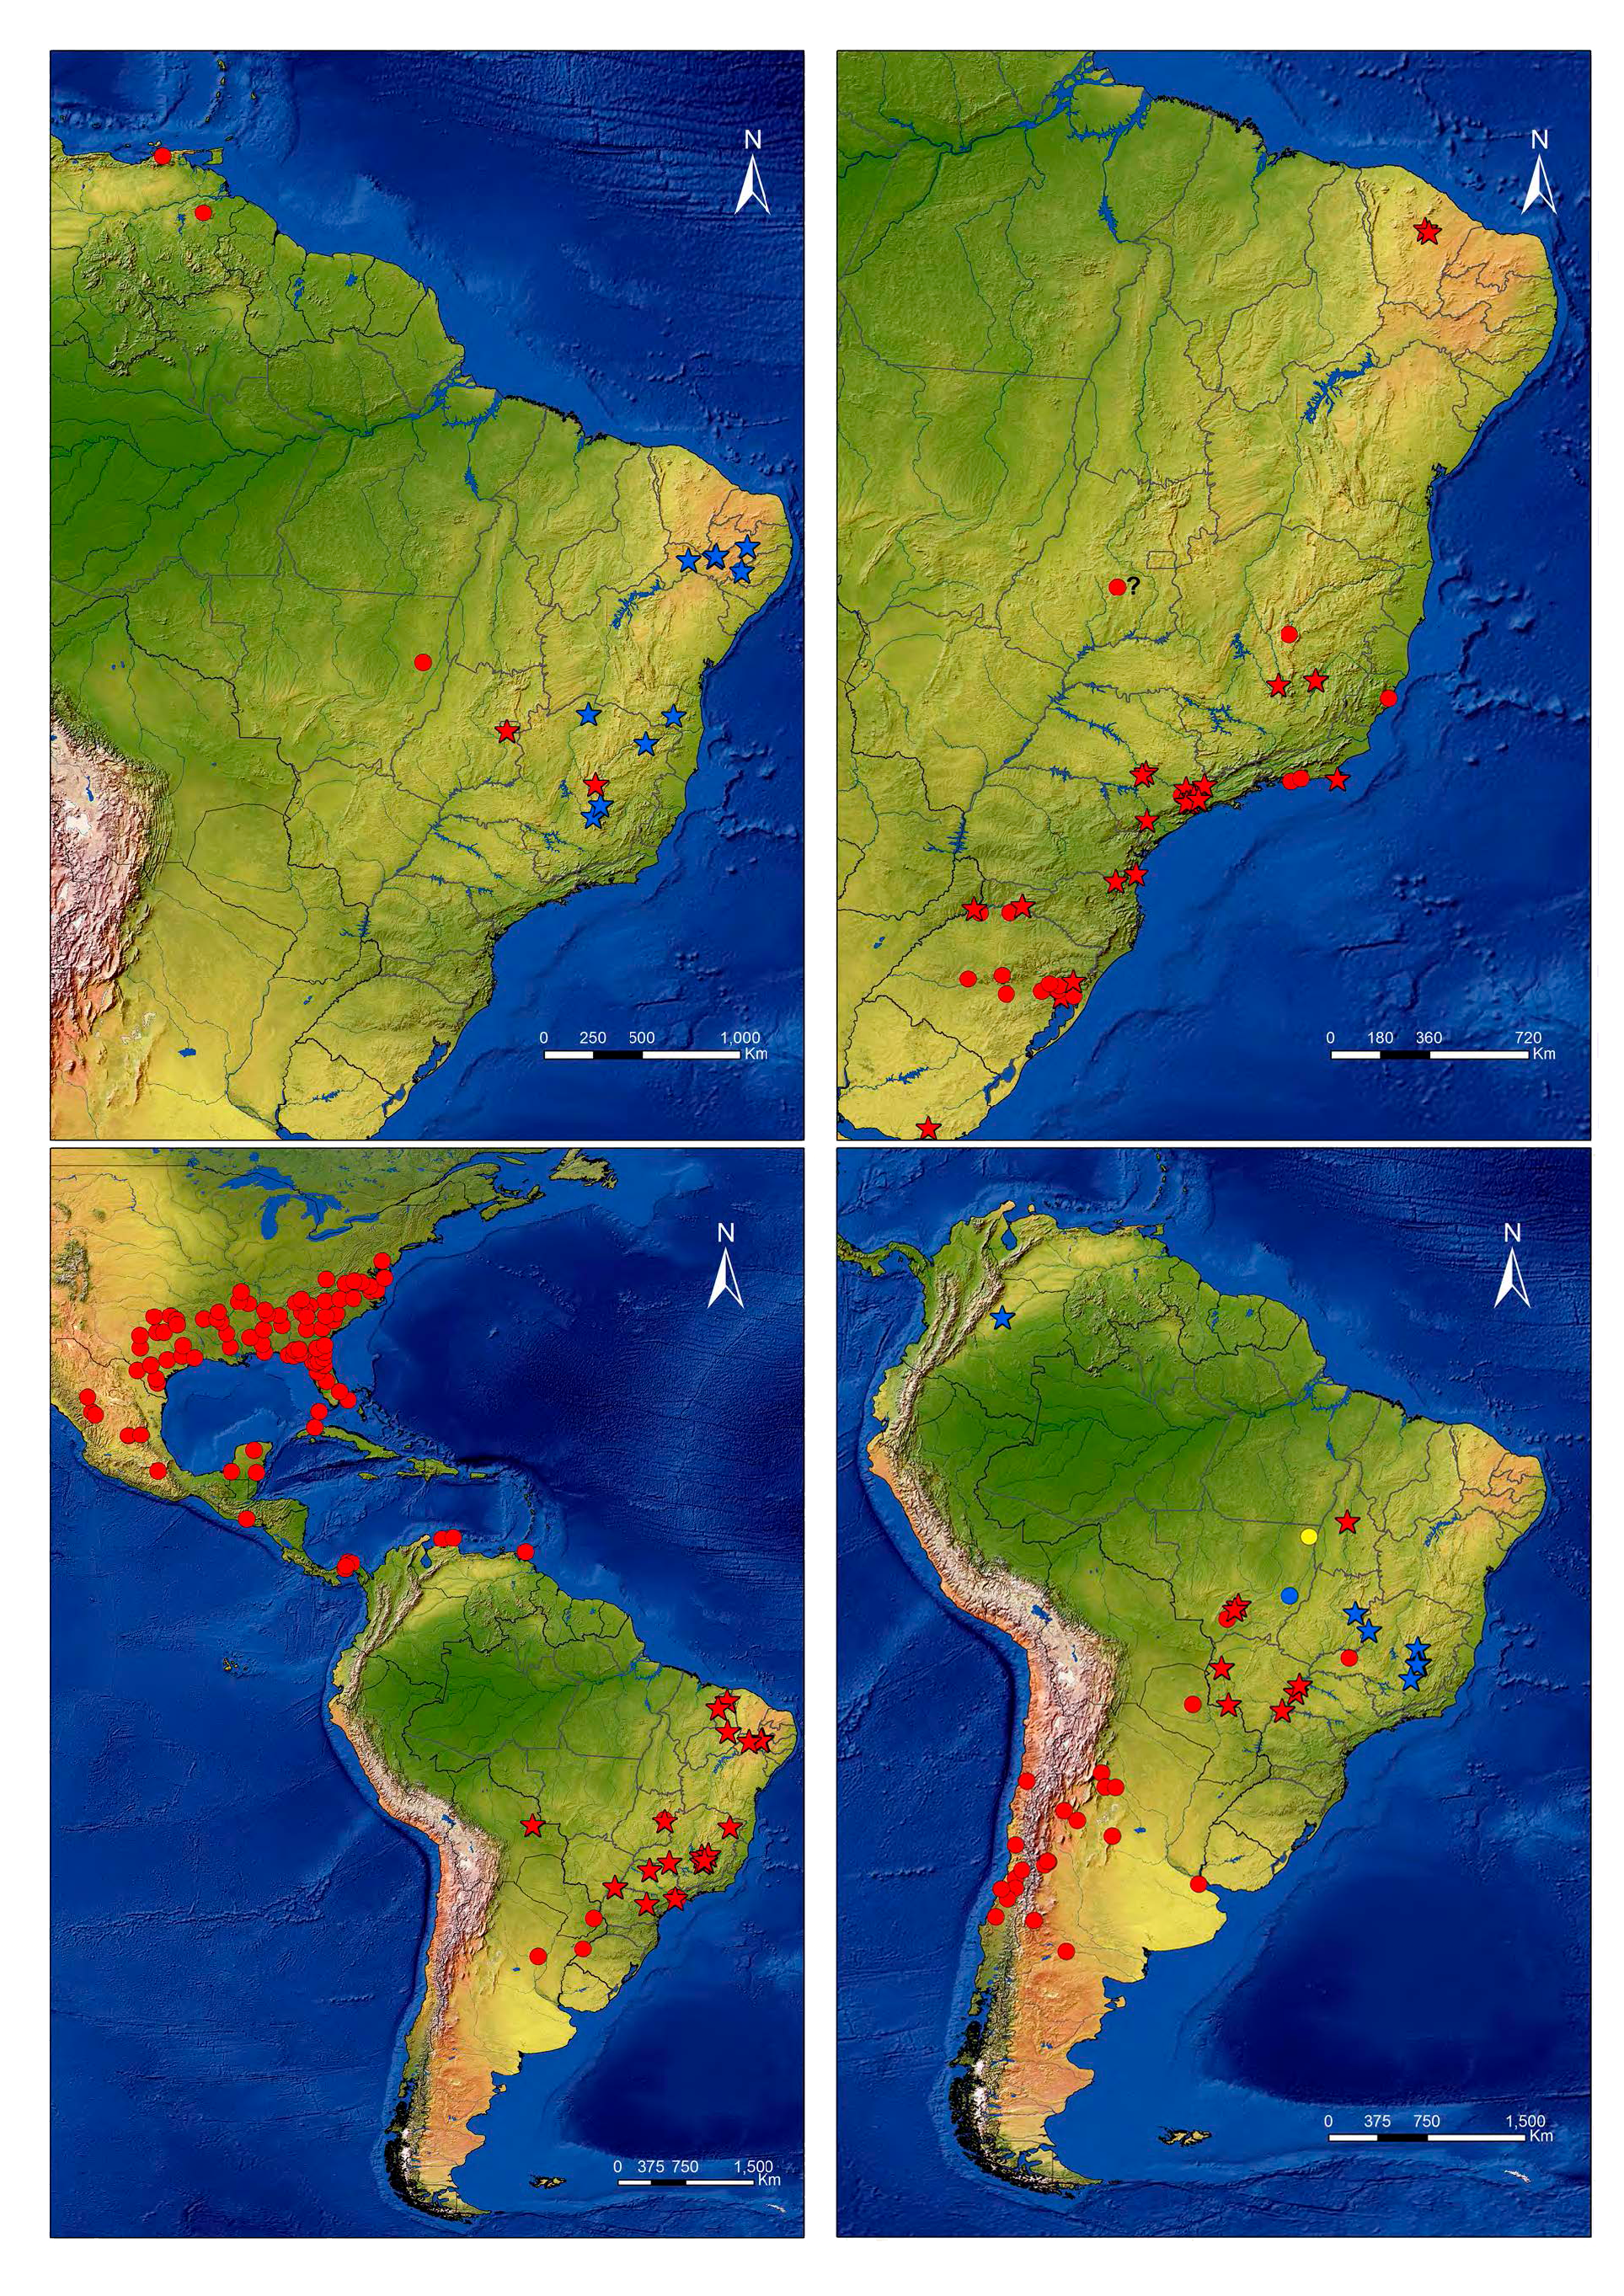
EN: Map showing the niche overlap between the potential distribution from native and invasive populations of the dinoflagellate Ceratium furcoides in the world. Red shades represent the invasive potential distribution; Blue shades represent the native potential distribution; Purple shades represent the overlap between these two model. Map published at: http://dx.doi.org/10.1007/s10750-020-04495-5
PT: Mapa mostrando a sobreposição de nicho entre a distribuição potencial de populações nativas e invasoras do dinoflagelado Ceratium furcoides no mundo. Tons de vermelhas representam a distribuição potencial de invasivo; Tons azuis representam a distribuição potencial de nativo; Tons roxos representam a sobreposição entre os dois modelos. Mapa publicado em: http://dx.doi.org/10.1007/s10750-020-04495-5


(1)(1)_3399962.png&w=3840&q=100)


