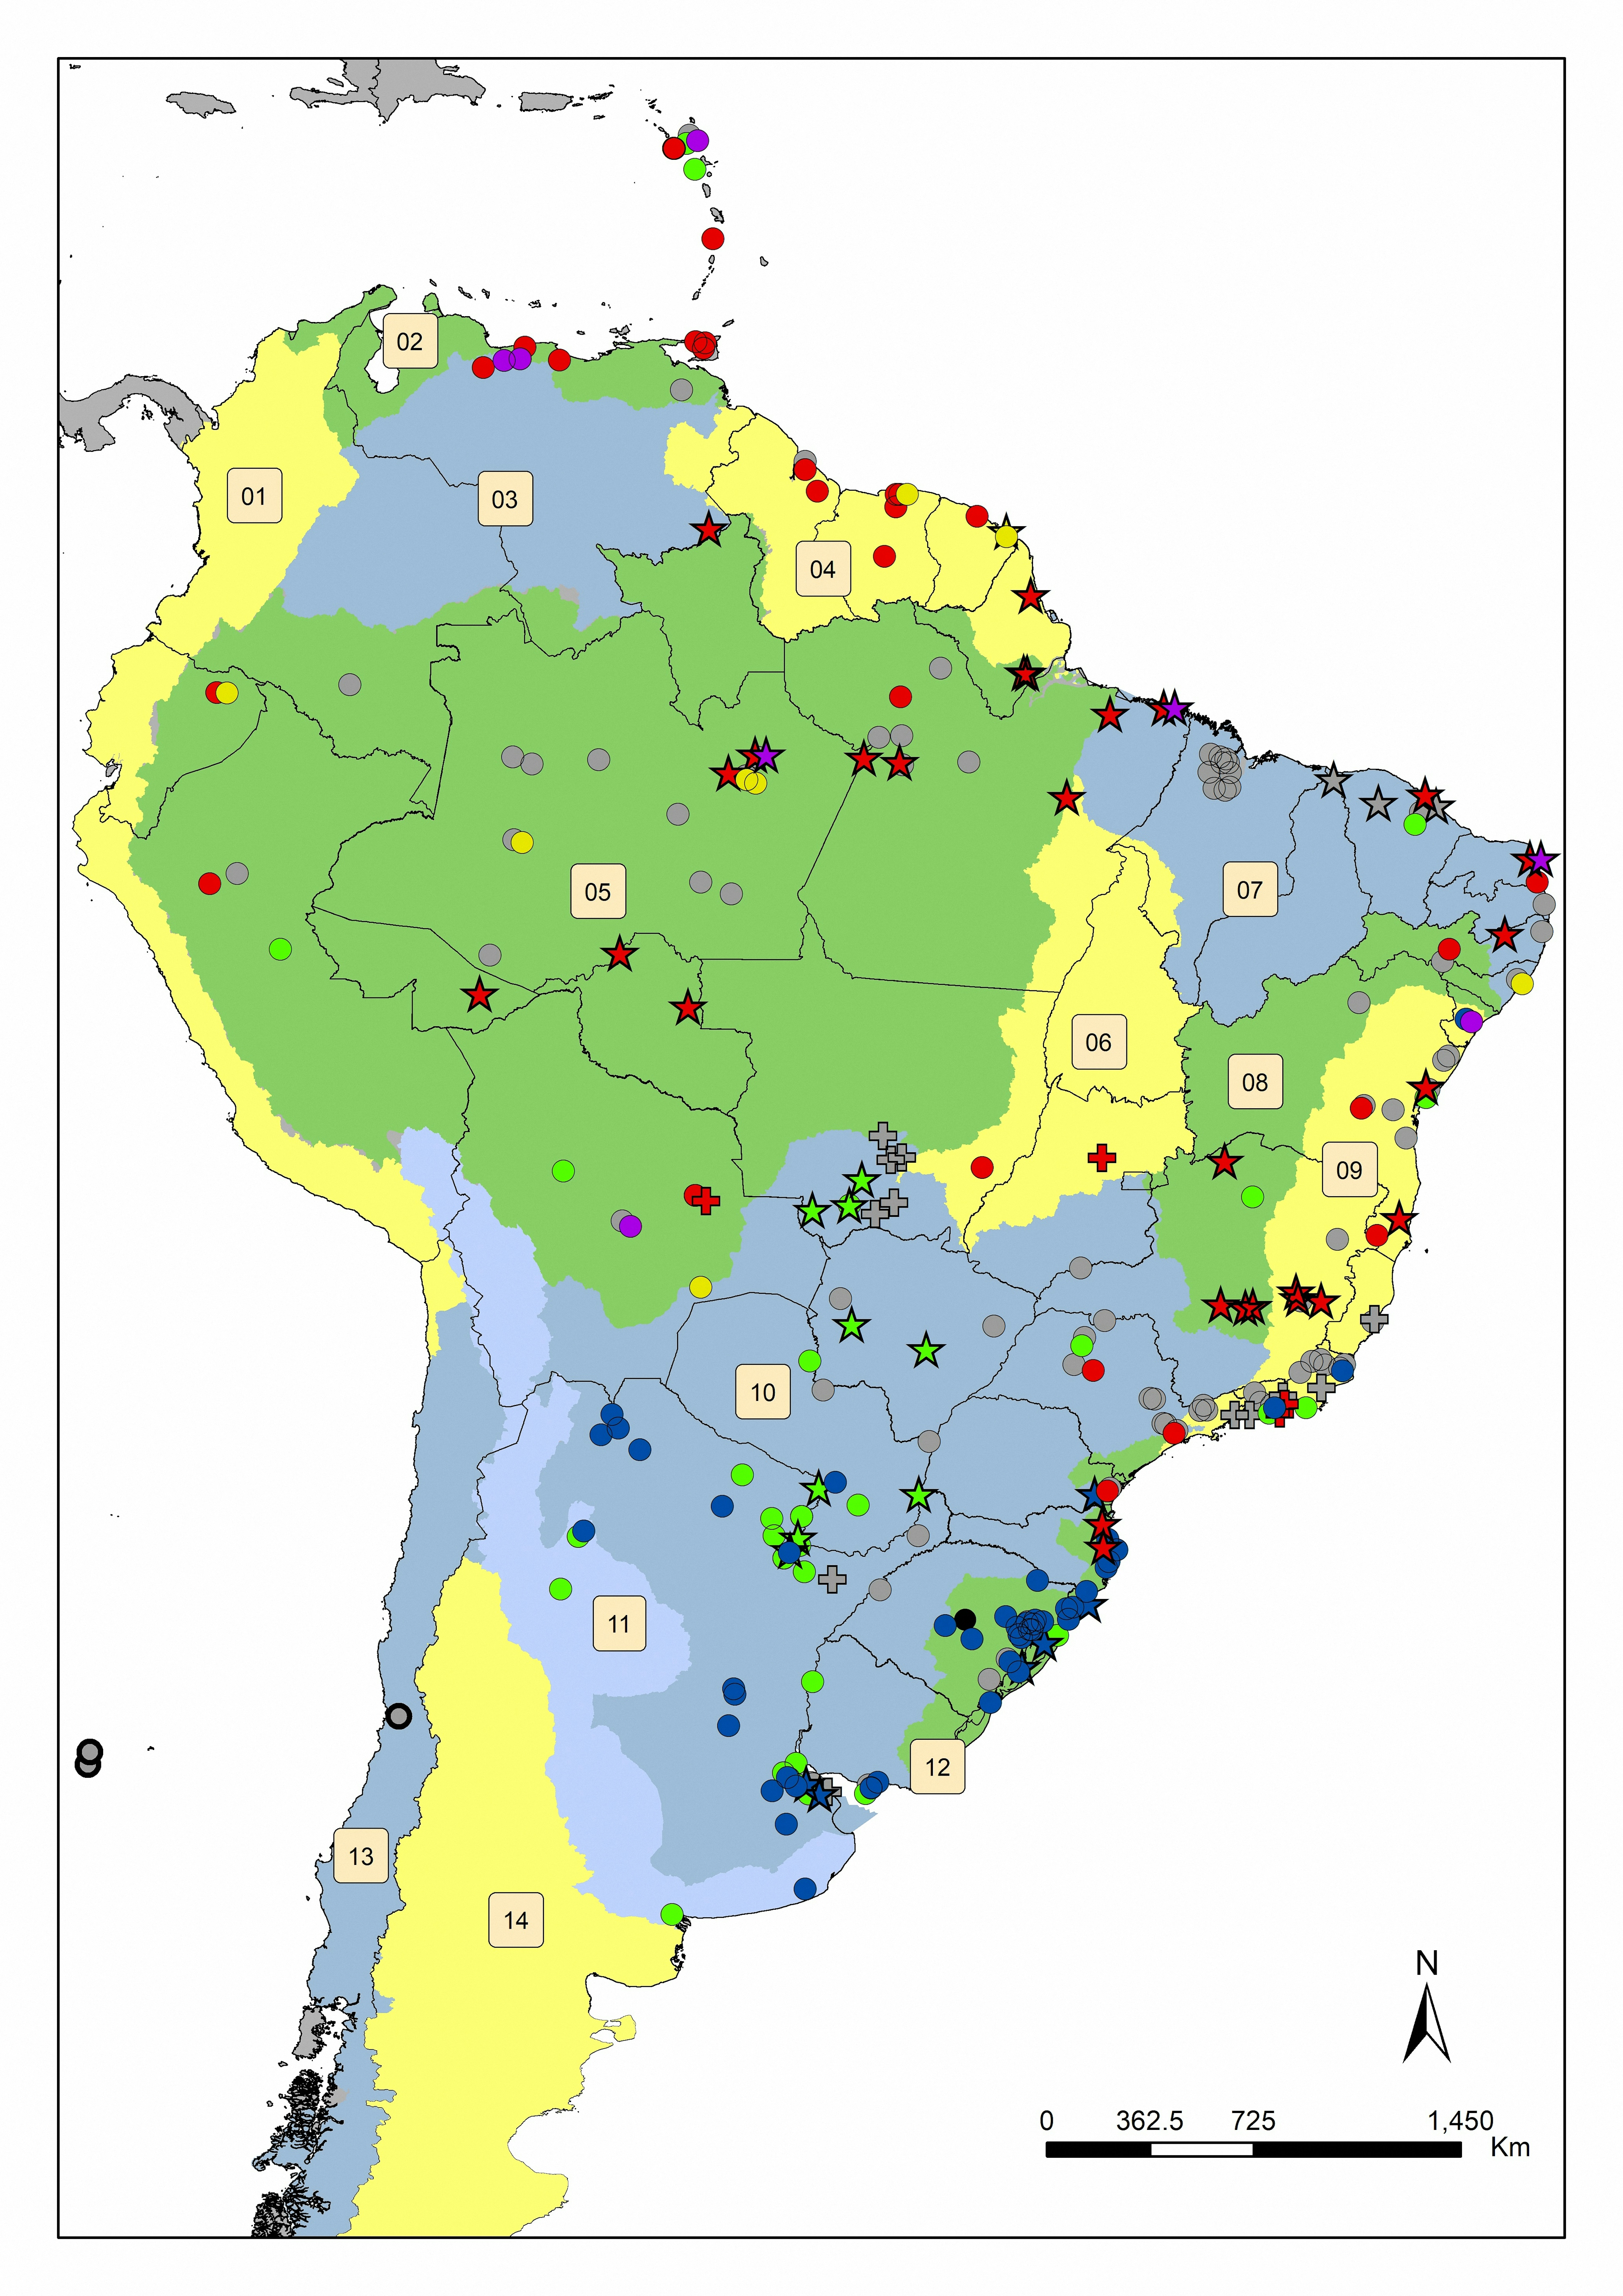
EN: Map showing the projection of the range expansion predicted to dinoflagellate Ceratium furcoides in the world. Red shades represent the future potential distribution at the scenarios of the climate change by CO2 emission (CMIP6); Blue shades represent the present potential distribution; Purple shades represent the overlap between these two model. Map published at: http://dx.doi.org/10.1016/j.ecolind.2021.108408
PT: Mapa com a projeção da expansão da área de distribuição prevista para o dinoflagelado Ceratium furcoides no mundo. Os tons vermelhos representam a distribuição potencial futura nos cenários das mudanças climáticas por emissão de CO2 (CMIP6); Os tons de azul representam a distribuição potencial atual; Os tons roxos representam a sobreposição entre esses dois modelos. Mapa publicado em: http://dx.doi.org/10.1016/j.ecolind.2021.108408