
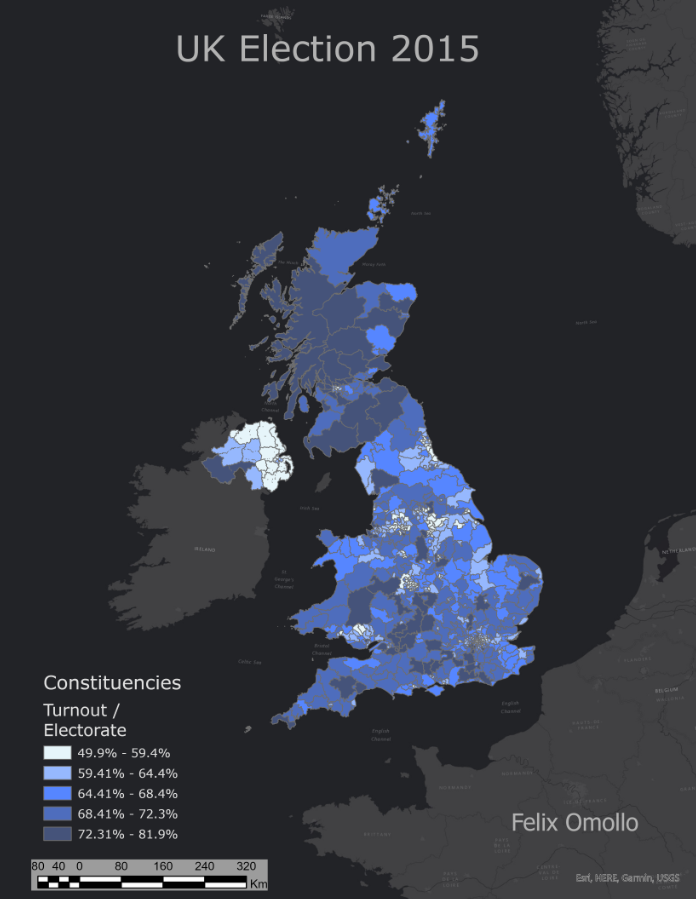
The map depicts the turnout of voters in different constituencies across the United Kingdom during the 2015 election. The color scheme used in the map visually highlights the turnout percentages, with darker shades representing higher turnout rates and lighter shades representing lower turnout rates. By examining the map, it becomes evident that the turnout rates varied considerably between different constituencies, with some areas having high voter turnout and others having much lower turnout rates.
This map serves as a powerful tool to understand the patterns and trends in voter turnout across the UK, and it can be used by researchers, policymakers, and citizens to gain insights into the political landscape of the country.


.svg "Keran Nkongolo")


