Introduction
QGIS, like other GIS software, allows you to create and explore 3D visualizations of your data, provided you have elevation data or a DEM. Recent versions of QGIS include native support for 3D data. Using this feature, we can easily view, explore and animate 3D elevation data. Note that your computer must have a supported graphics card for this feature to work.
This tutorial will guide you through creating a basic 3D view of a Digital Elevation Model (DEM) in QGIS.
Create a 3D Visualization
We will work with a 5m Digital Elevation Model (DEM) which is for Denali peak in Alaska and create a 3D visualization of the dataset.
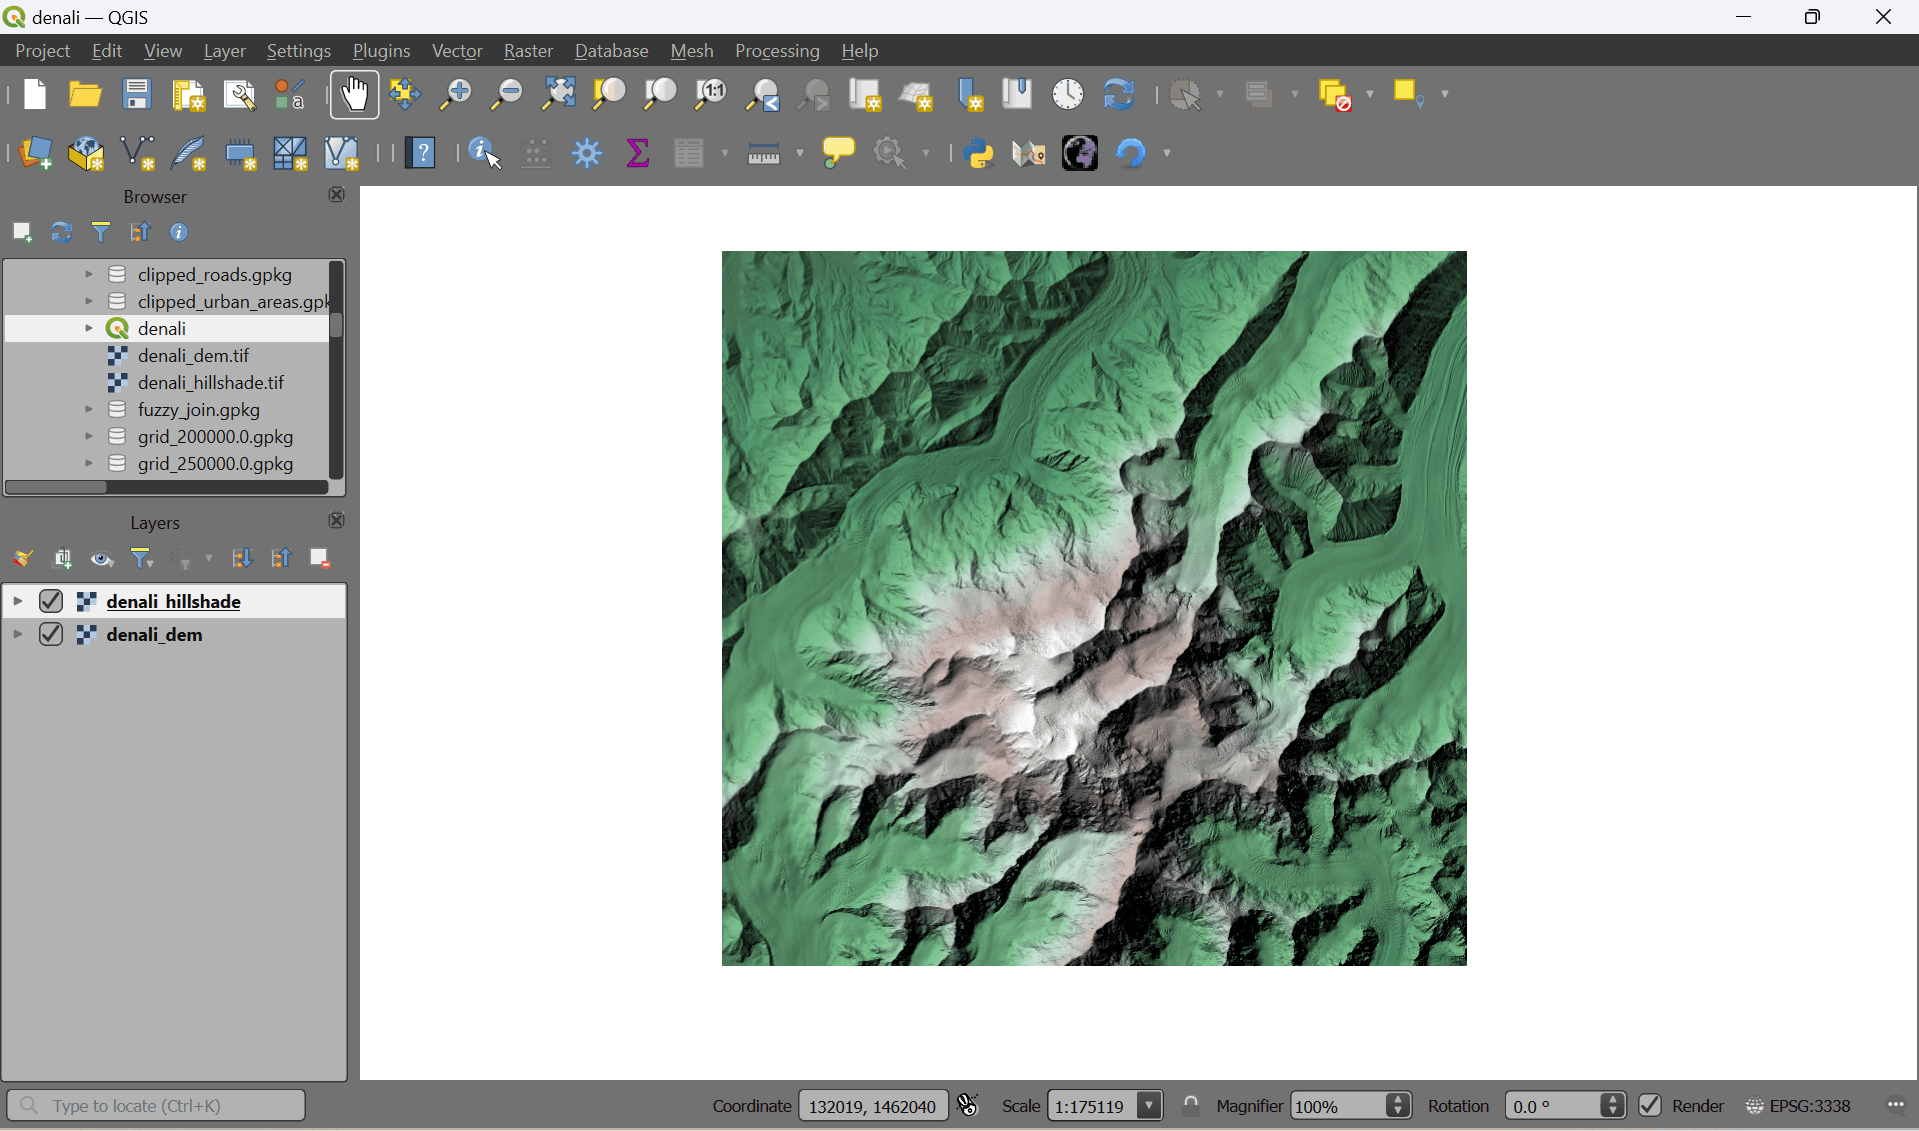
- Open the denali project from the data package. The data contains the raw DEM layer and a hillshade layer created from the DEM.
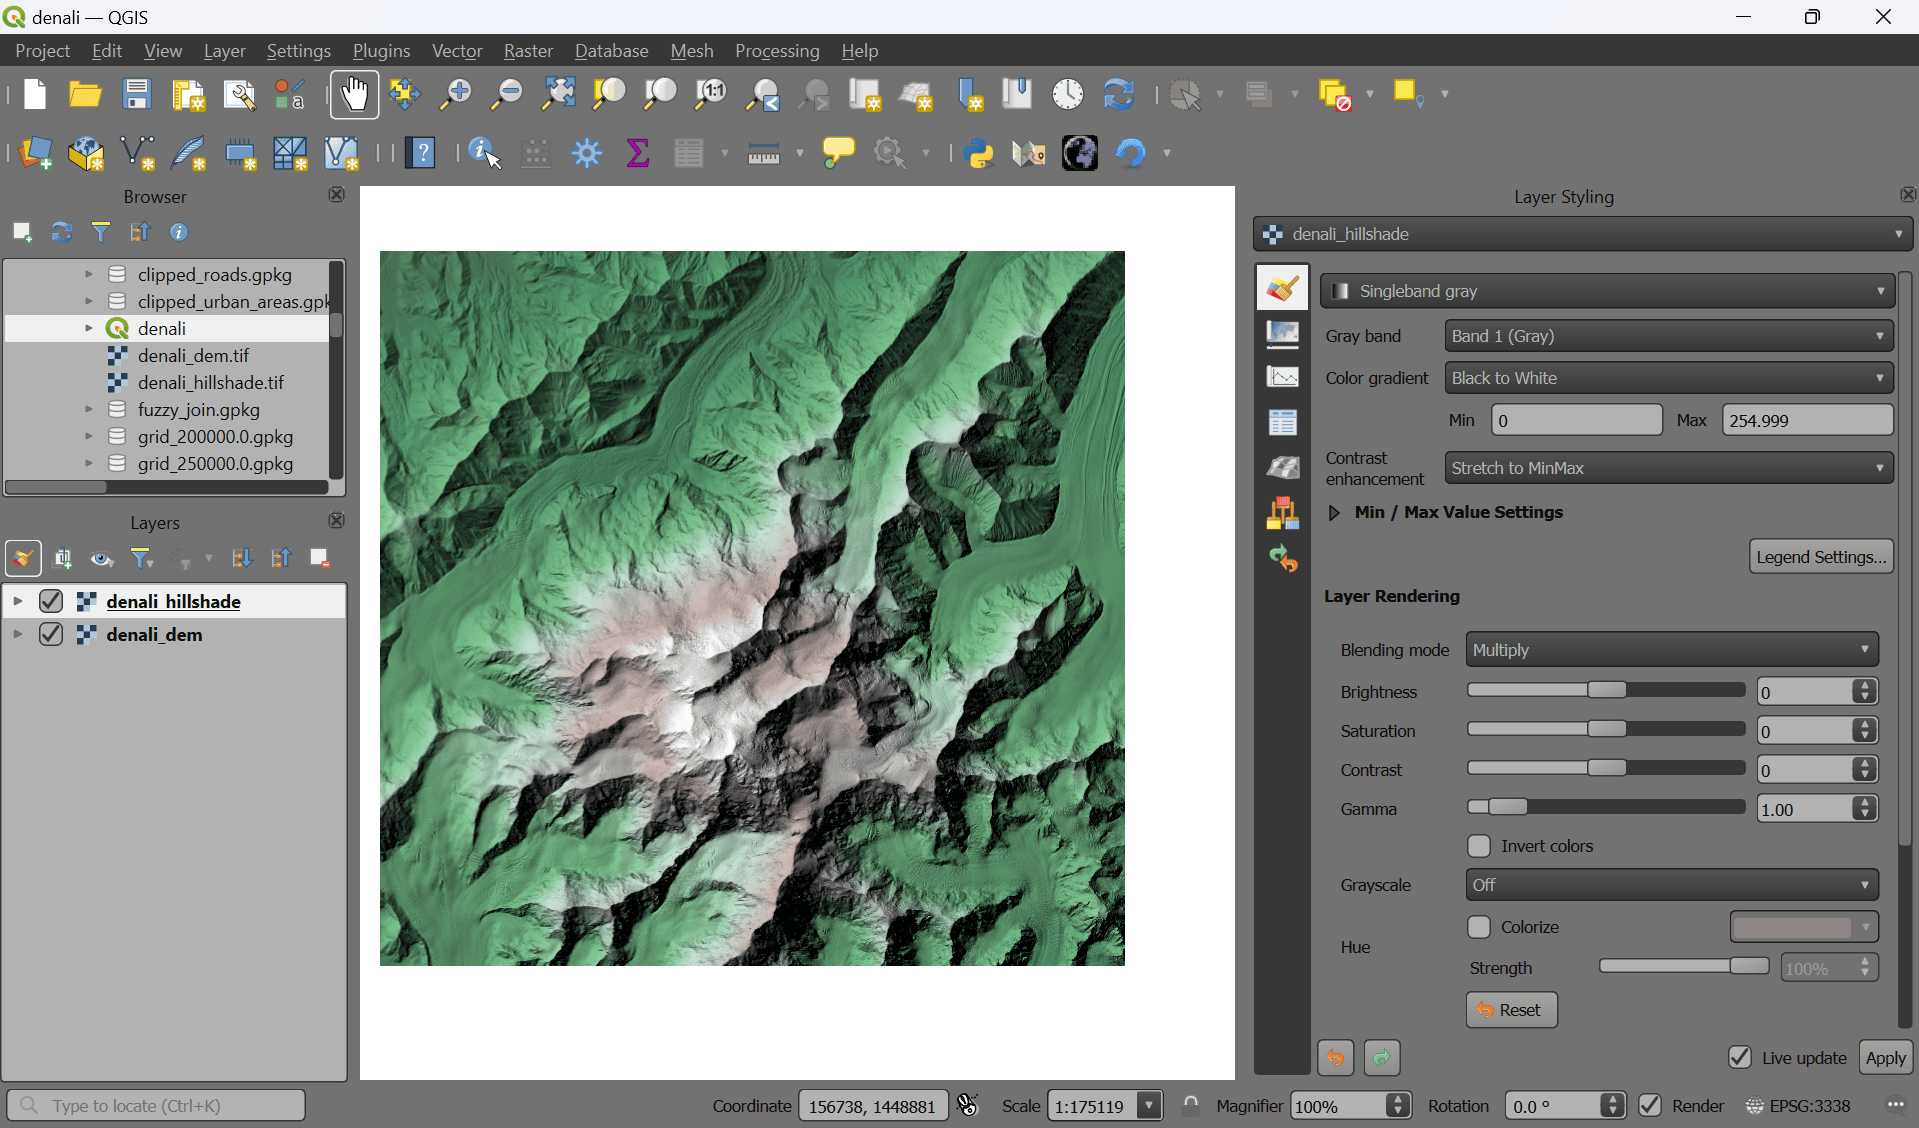
- Let’s create a colorized hillshade. It is possible to drape an image or colorized DEM to a hillshade layer using QGIS’s Layer Blending Modes. Click on the Open the Layer Styling Panel icon. In the Layer styling panel, choose denali_hillshade and under Layer Rendering choose Multiply as Blending mode. The selected layer will be blended with the bottom layer. This is a great way to visualize your elevation dataset.
- Let’s view this data in 3D. Go to View → 3D Map Views → New 3D Map View.
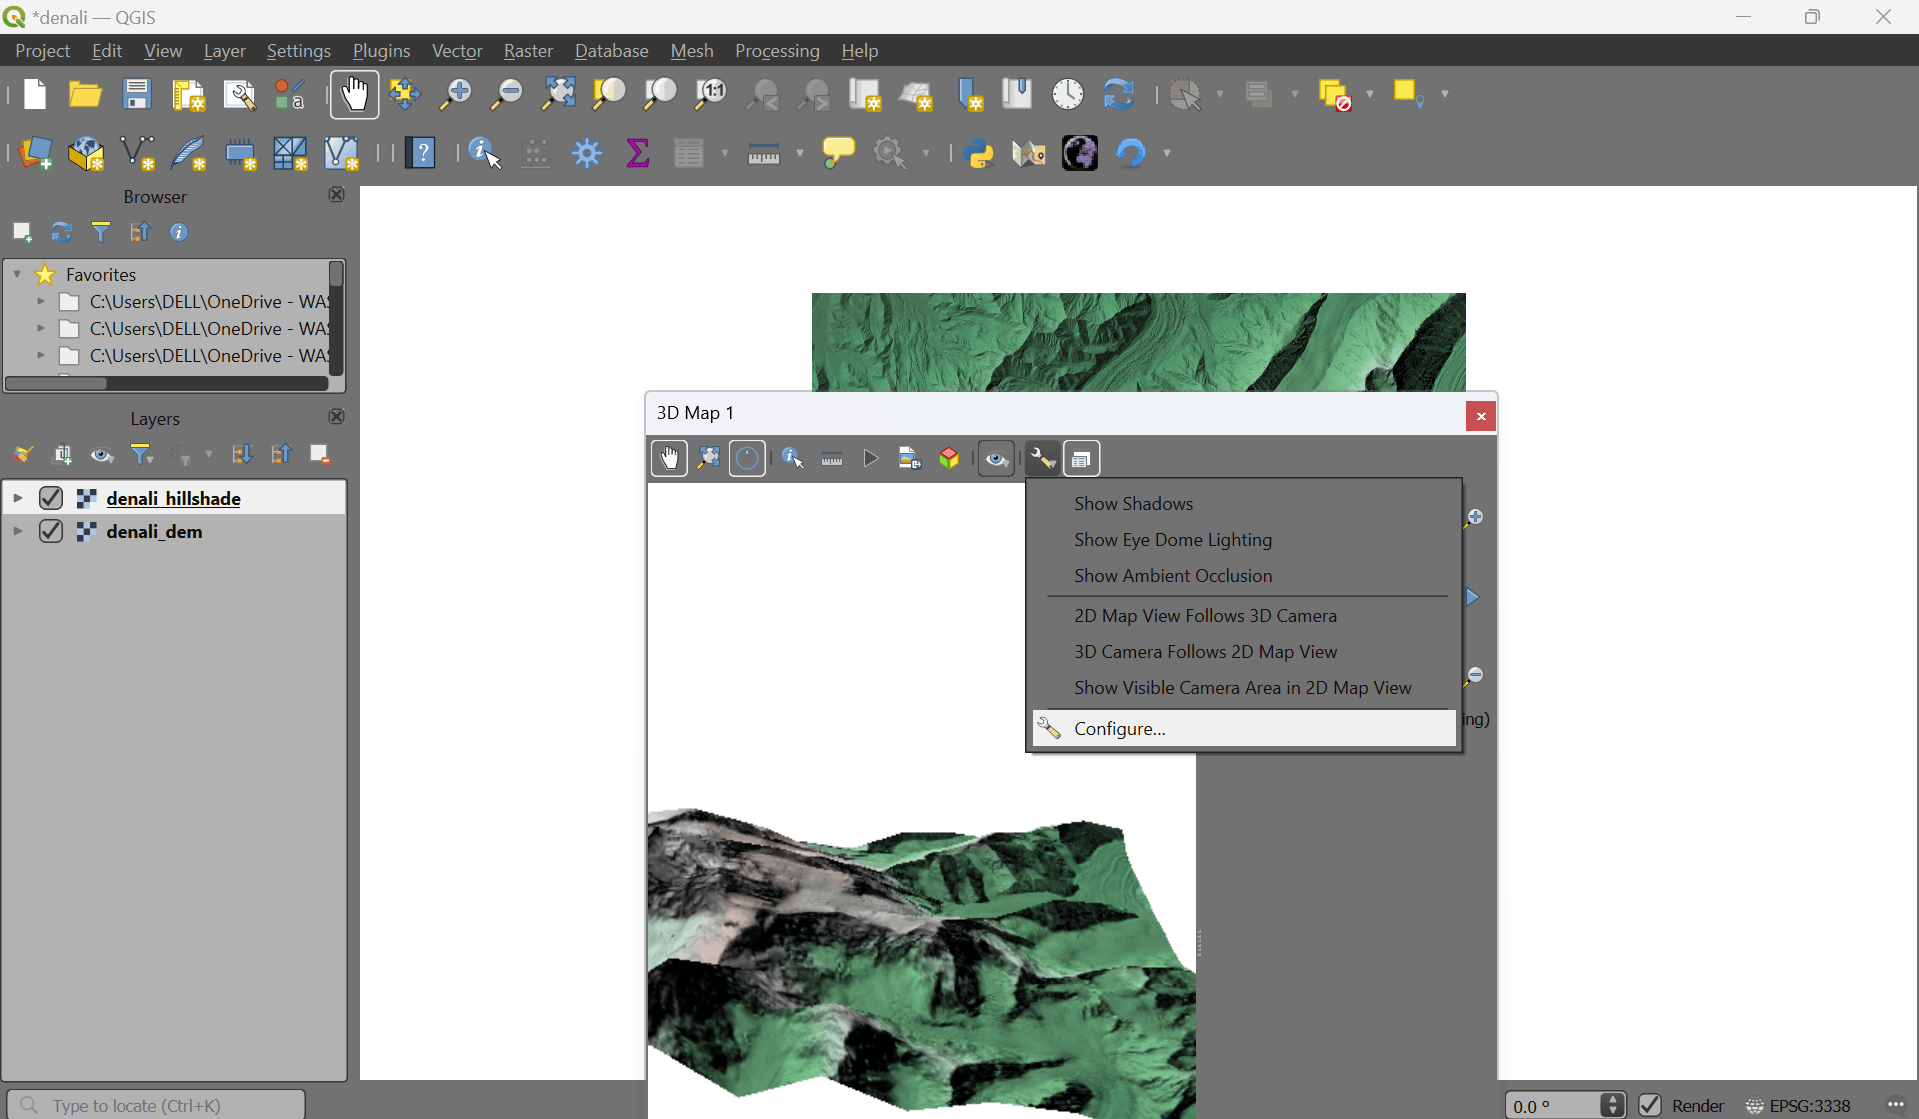
- A new map window will open containing the rendered map layers from the main canvas. Click the Configure button.
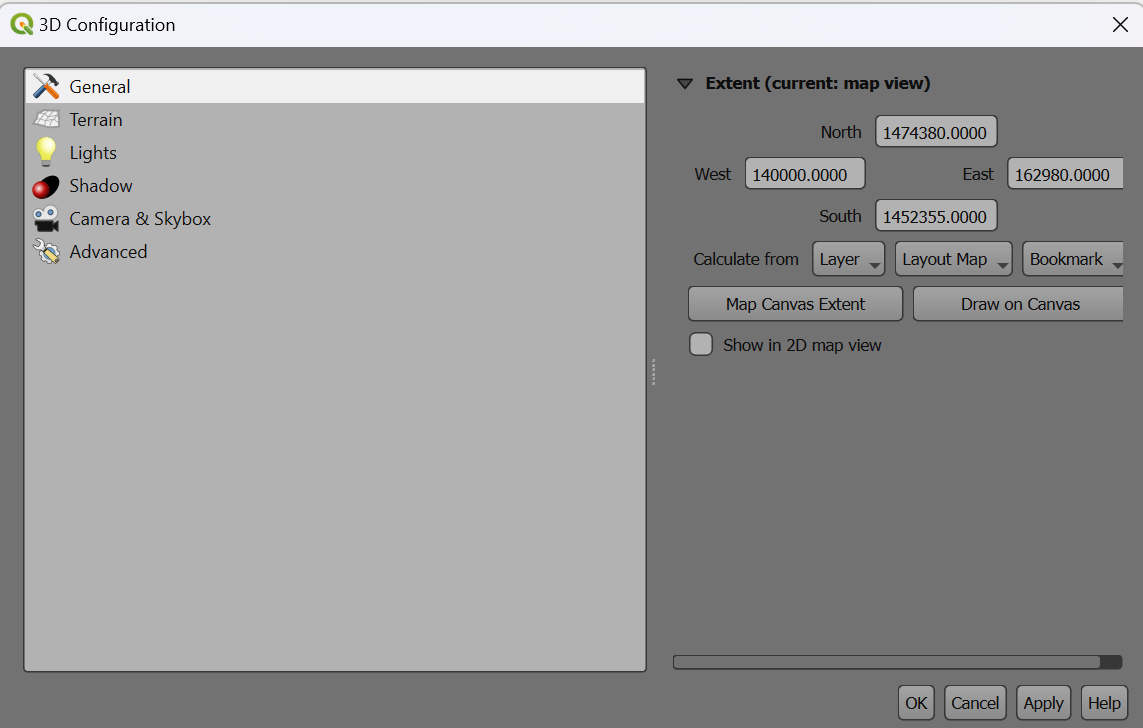
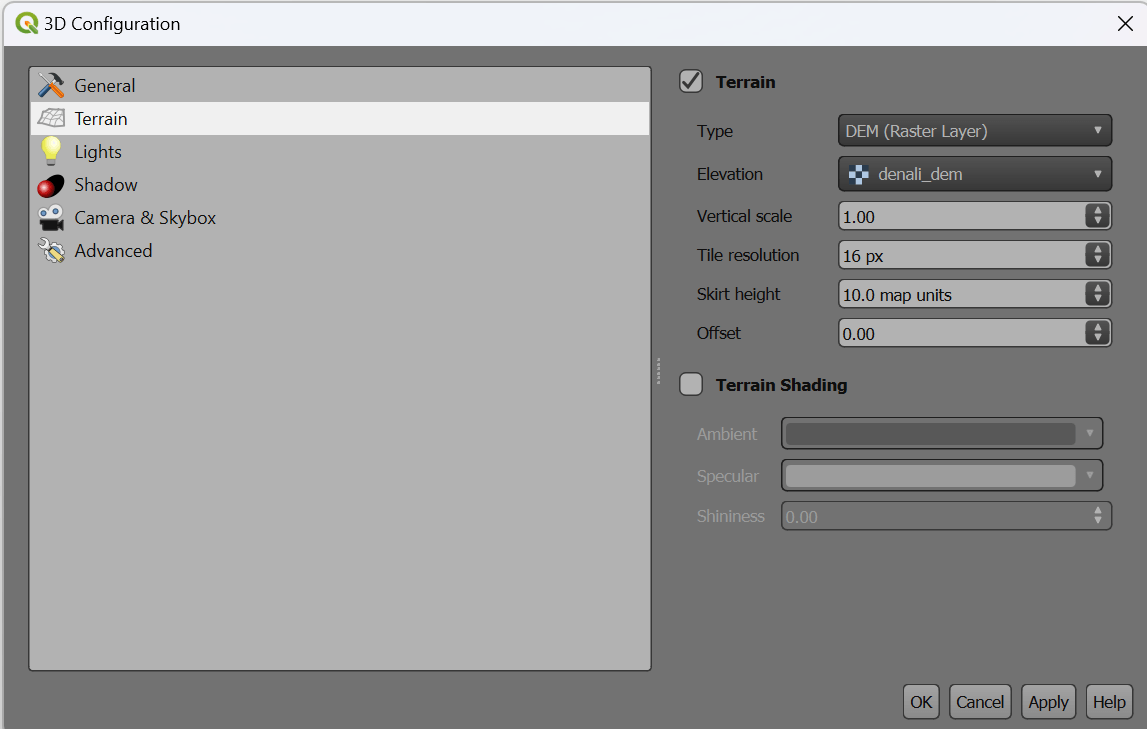
- In the Terrain section, select DEM (Raster Layer) as the Type. Select denali_dem layer as the Elevation. Click OK.
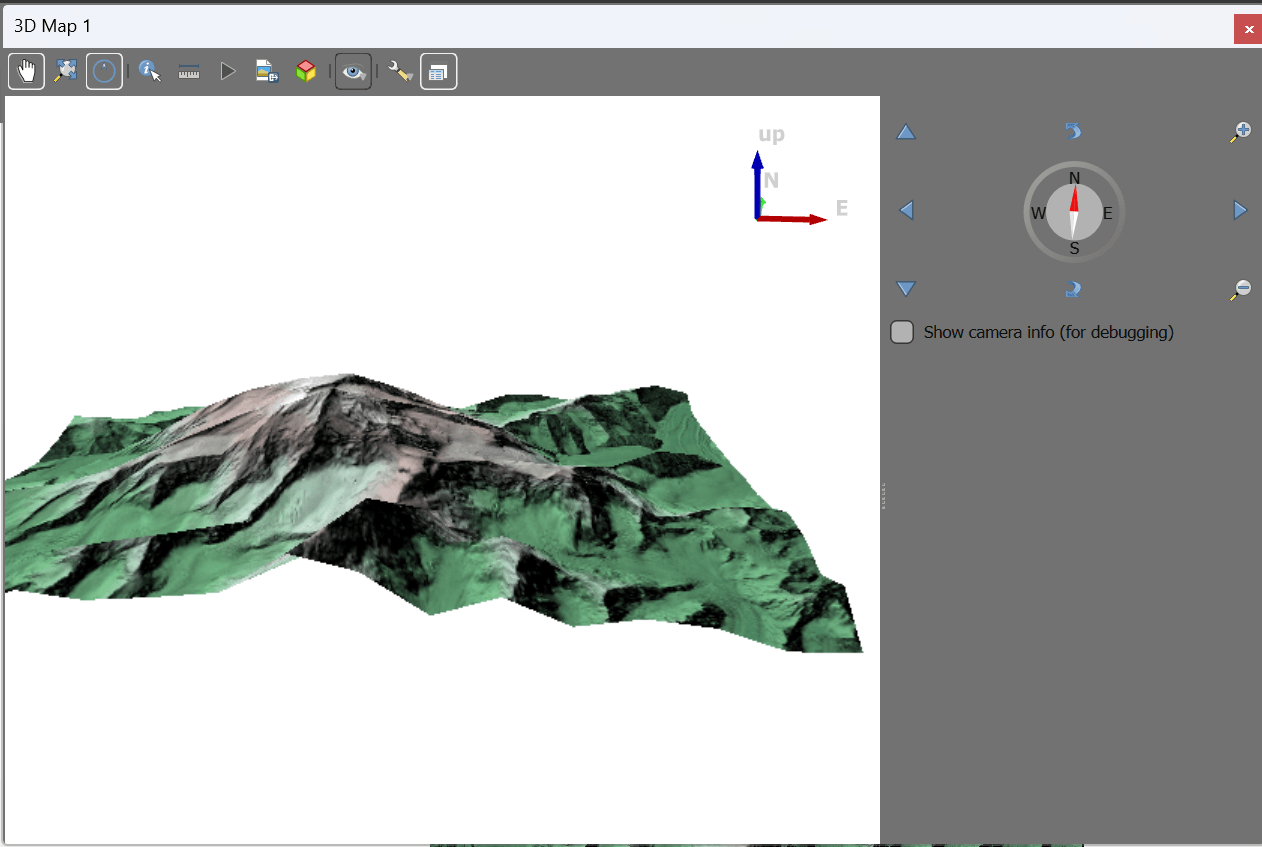
- In the 3D view, you can hold the Shift key and drag your mouse to tilt the top-down view. You will see the map in 3D. You can also use the controls on the right-hand panel to tilt, zoom and pan the view.
Create a 3D Fly-through
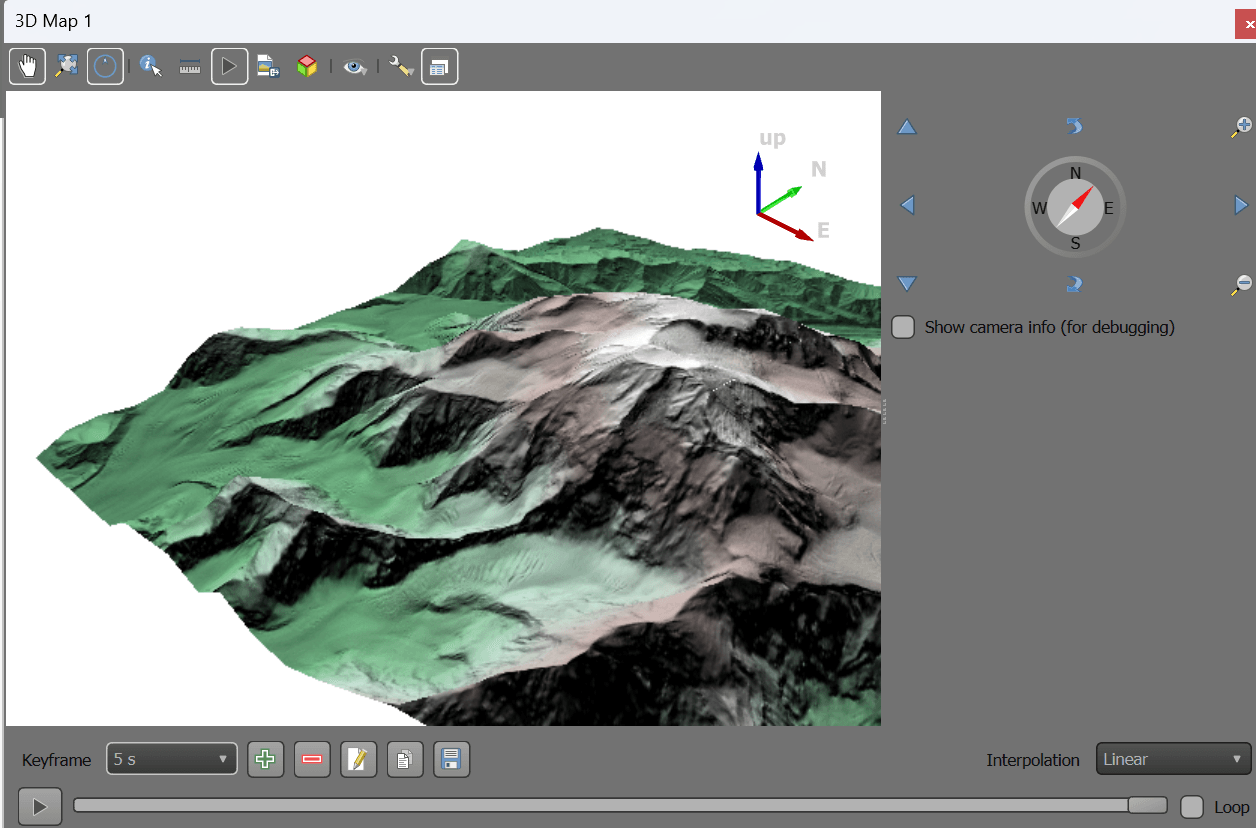
- Now we will create an animation. Click the Animations button in the toolbar. To animate the view, we must define certain keyframes. Once you define a specific view for keyframes at different times, the system will try to smoothly animate the views between them. You can use the slider to go to a specific time, use the controls to set a specific view and click the + button to add a keyframe. Click the Play button to see the animation in action.
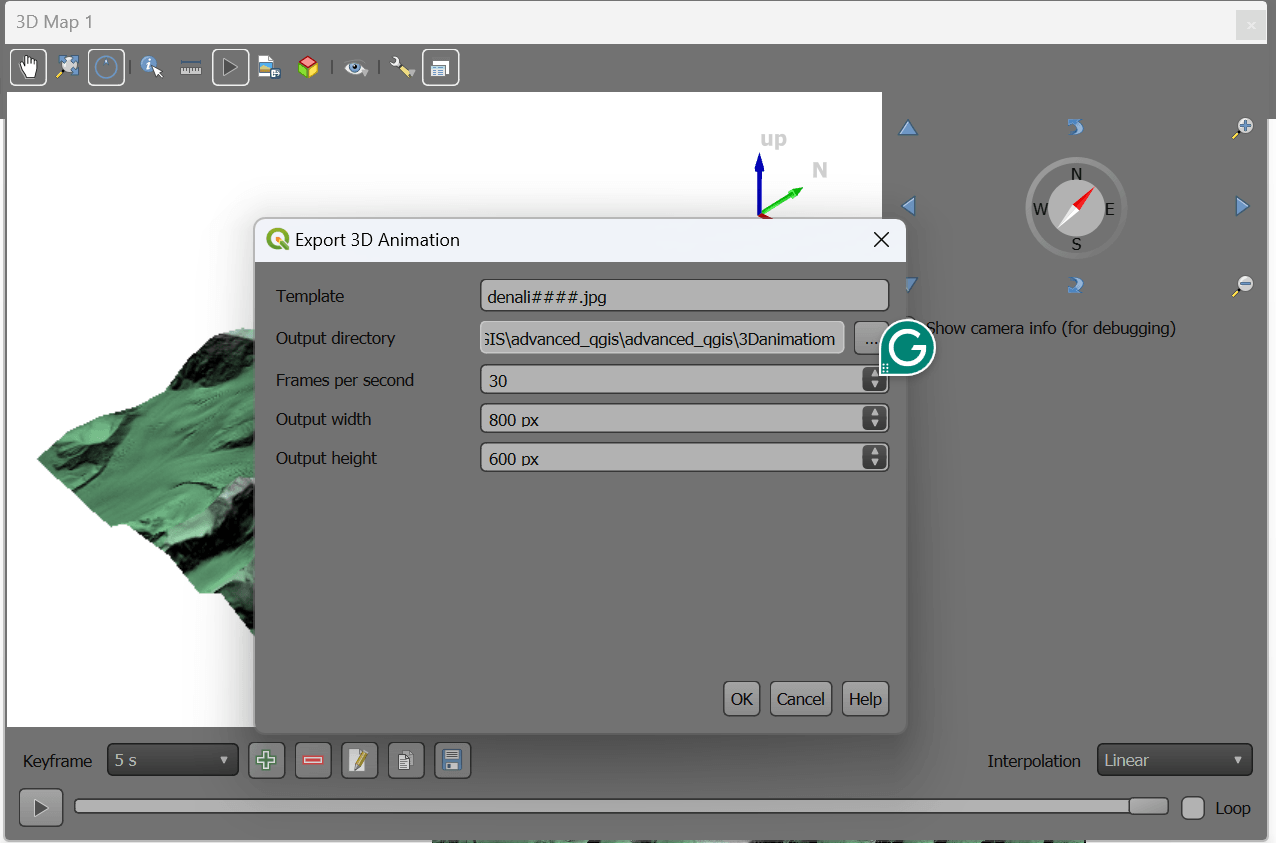
- Once you are satisfied, click the Export Animation Frames button. Choose an output directory on your computer and click OK. Individual frames will be rendered and saved as separate files.
Creating an animated gif
Once the images are saved , we can use a service such as ezgif.com to create a GIF/Video from these frames.
