Introduction
Drought monitoring in Niger Republic involves the systematic observation and analysis of water scarcity conditions, which significantly affect the country's agriculture, water resources, and overall socio-economic stability. Drought, characterized by prolonged periods of inadequate rainfall, is a recurrent challenge in Niger, exacerbating food security issues and economic hardships. This study utilizes advanced remote sensing techniques to monitor drought conditions, providing valuable insights for effective management and mitigation strategies.
Study Area
The Republic of Niger is a landlocked country located in West Africa, bordered by Algeria, Libya, Chad, Nigeria, Benin, Burkina Faso, and Mali. Niger has a diverse landscape that includes parts of the Sahara Desert, the Sahel, and savannah regions. The country has an estimated population of about 24 million people, with the majority living in rural areas and engaged in farming and livestock activities. The climate in Niger is predominantly hot and dry, with significant variations in temperature and precipitation. Over the years, there has been a gradual increase in urbanization and development, especially in the capital city, Niamey.
Materials
The datasets used for this study include:
CHIRPS Daily: Climate Hazards Center InfraRed Precipitation with Station data.
Shapefile from IGNN: Institut Geographique National du Niger.
Google Earth Engine (GEE) was utilized for processing the satellite data and calculating the drought indices.
Methodology
Data Preprocessing:
Import the CHIRPS dataset and the Niger shapefile into Google Earth Engine.
Filter the images by date, clip to the area of interest (AOI), and calculate the mean rainfall over the specified period to assess drought conditions.
Drought Indices Calculation:
Compute the Vegetation Condition Index (VCI) to evaluate the relative greenness of vegetation, indicating drought stress.
Calculate the Standardized Precipitation Index (SPI) to quantify precipitation deficits, a key indicator of meteorological drought.
Result
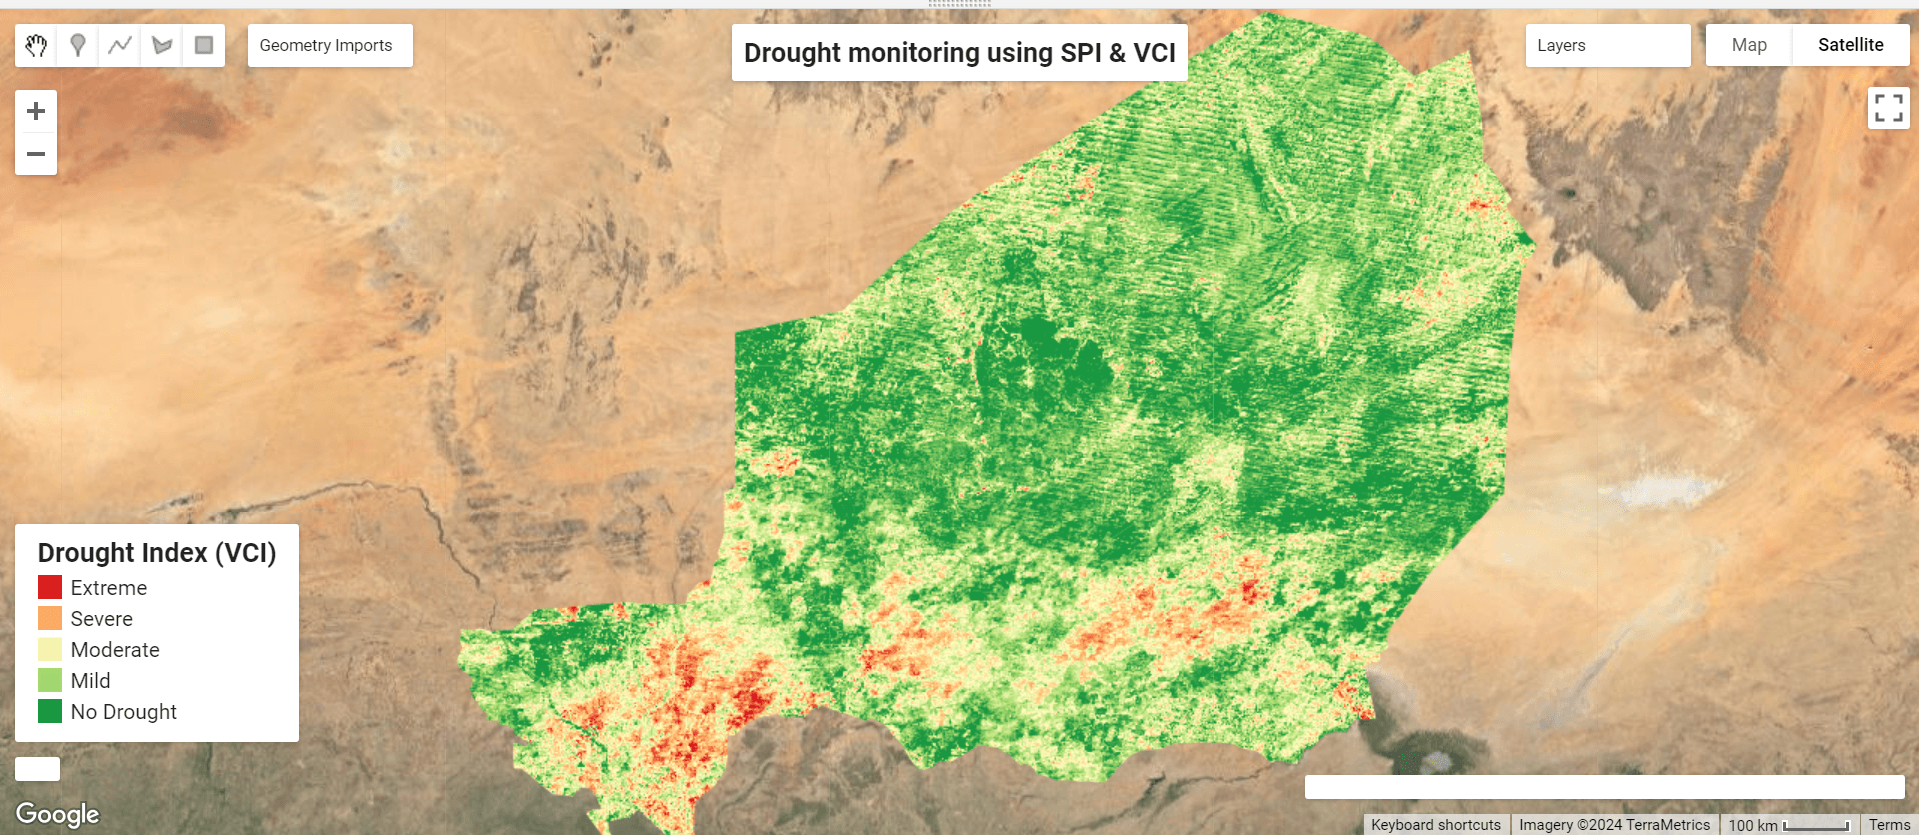
Vegetation Condition Index (VCI) Map
The Vegetation Condition Index (VCI) map reveals areas in Niger experiencing varying levels of drought stress based on vegetation greenness. The map highlights regions with severe to extreme drought conditions, particularly in the northern and central parts of the country.
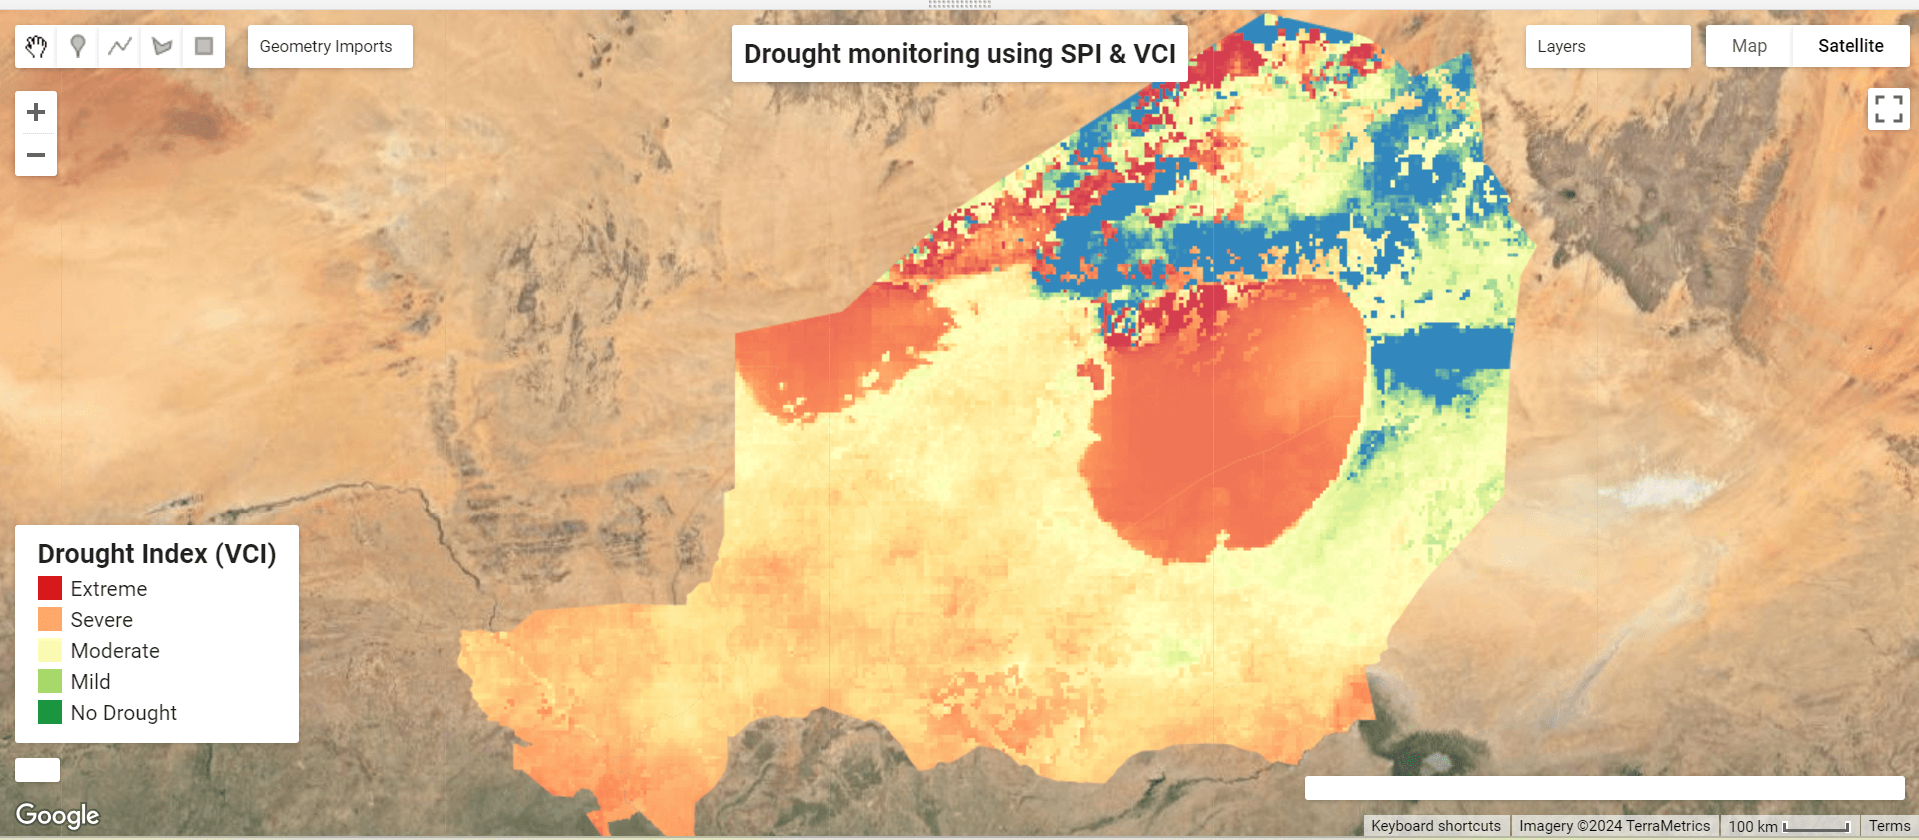
Standardized Precipitation Index (SPI) Map
The Standardized Precipitation Index (SPI) map shows the distribution of precipitation deficits across Niger. Areas with negative SPI values indicate below-average rainfall, correlating with regions prone to drought.
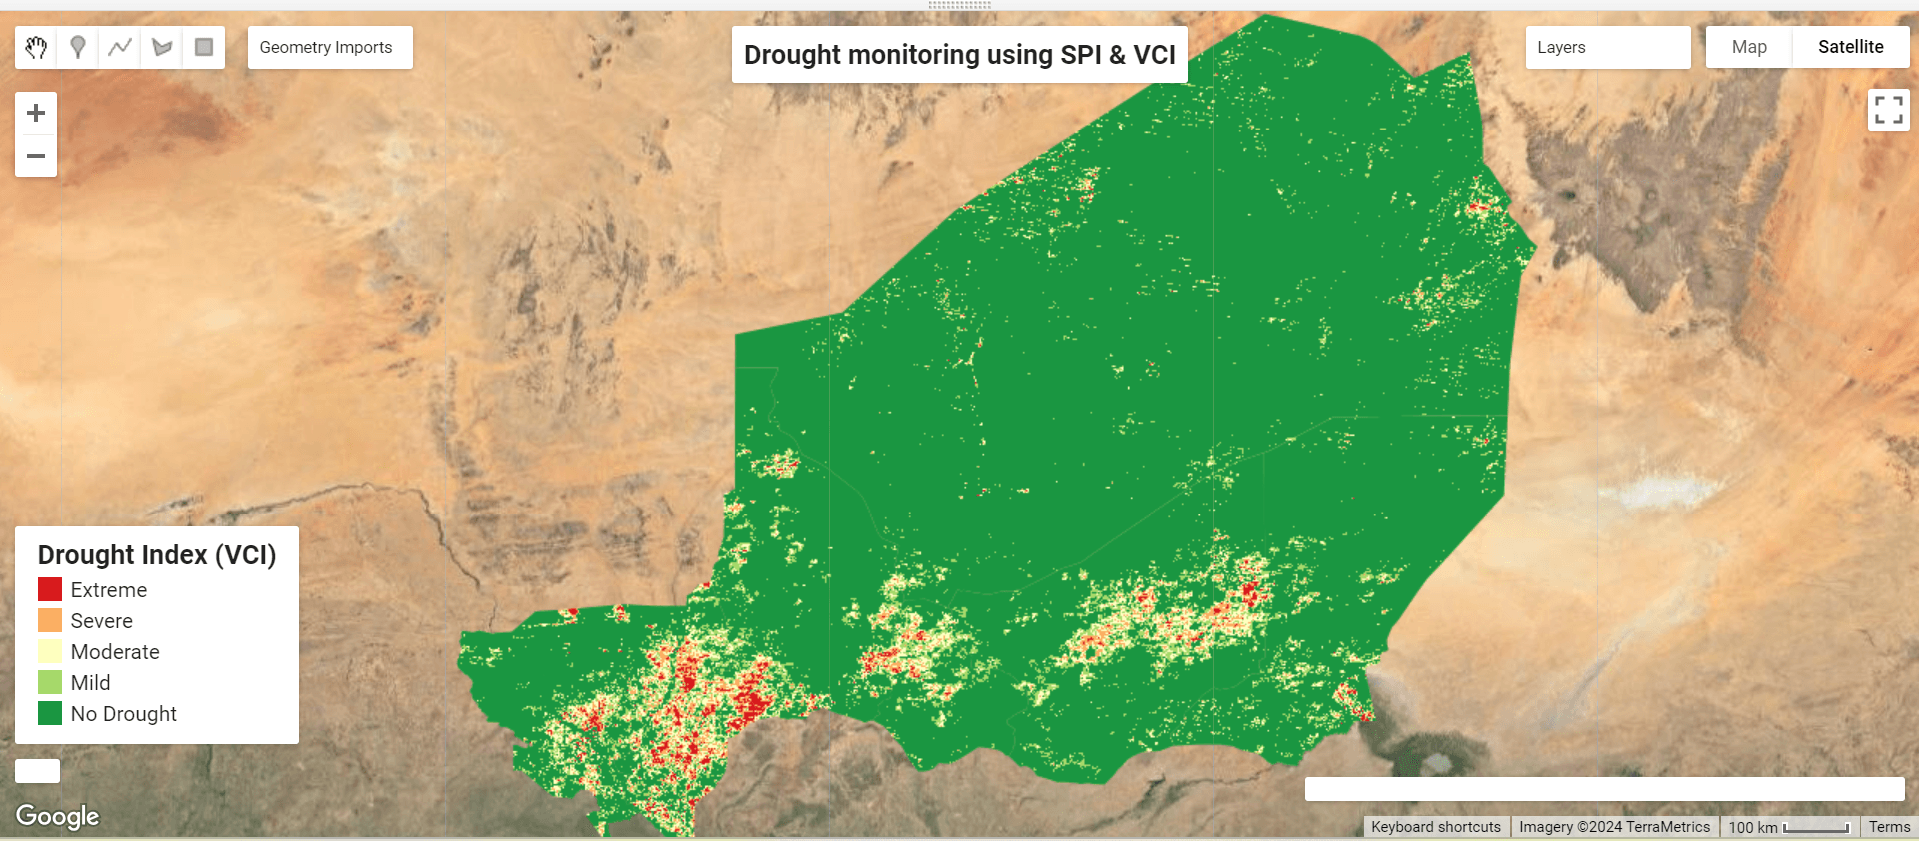
Combined Drought Monitoring Map
The combined drought monitoring map integrates both VCI and SPI results, providing a comprehensive overview of drought conditions in Niger. The map categorizes areas into extreme, severe, moderate, and mild drought conditions, aiding in the identification of critical drought hotspots.
Conclusion
This project demonstrates that Niger Republic is significantly affected by drought, particularly in the northern and central regions. The Vegetation Condition Index (VCI) and Standardized Precipitation Index (SPI) maps provide valuable insights into the spatial distribution and severity of drought conditions. The integrated drought monitoring map highlights the critical areas requiring immediate attention and intervention for effective drought management. These findings are essential for developing targeted drought mitigation strategies and ensuring sustainable land and water resource management in Niger.
Skills Demonstrated
Cloud dataset (Google Earth Engine) analysis
Satellite remote sensing and data analysis
Data visualization and interpretation
This study showcases the application of remote sensing technologies and GEE in drought monitoring, contributing to better preparedness and response strategies in Niger Republic.