 He")

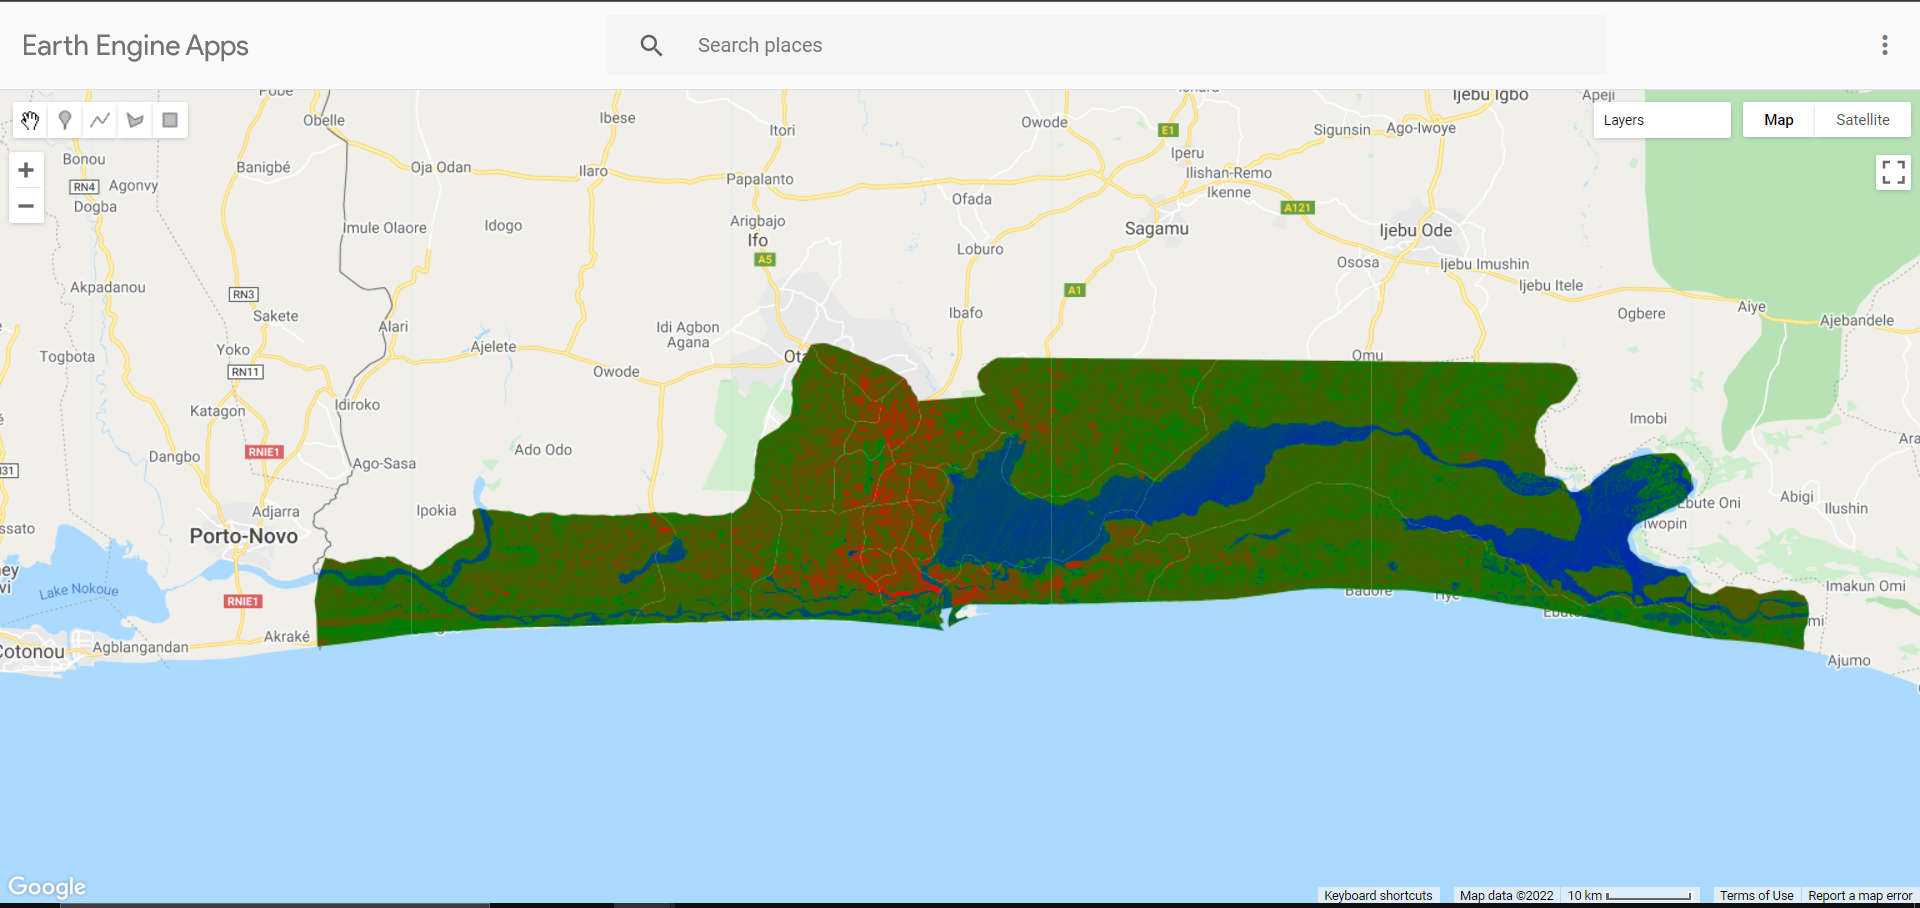
This project analyzed stream water quality across 15 watersheds in Gwinnett County, Georgia, using USGS data from 2000 to 2010. I focused on two key water quality indicators: Biochemical Oxygen Demand (BOD) and pH level. Higher BOD values indicate more organic pollution, while pH values outside the 6.0–9.0 range may suggest acidity or alkalinity problems. Using QGIS, I created visual maps to show changes over time by overlaying circular BOD markers and shaded pH values on watershed and stream buffer shapefiles. This analysis provides insights into watershed health and spatial patterns of environmental risk, valuable for both residents and local sustainability planning.
Water Quality Trends in Gwinnett County
Plug-ins used
Basic Cartographic Design Shapefile ViewerSymbology ToolsUSGS Stream Water Quality Dataset
tags
Environmental MonitoringQGISwater qualitywatershed analysis
More by Yuxin (Sienna) He

.png&w=3840&q=100)

.png&w=3840&q=100)

.png&w=3840&q=100)
.png&w=3840&q=100)

You might also like


![Projeto - Análise Espacial [1/2]](/_next/image?url=https%3A%2F%2Fstorage.googleapis.com%2Fspatialnodefiles%2Fprojects%2F9c96159b-e45d-4811-b8b1-236f8d9c3a98layoutmapametro.png&w=3840&q=100)


Join the community!
We're a place where geospatial professionals showcase their works and discover opportunities.