As part of the academic requirements in the "GEOG 197: Digital Cartography" course unit, I was instructed to create maps using other GIS tools, specifically Leaflet JS and Tableau. .
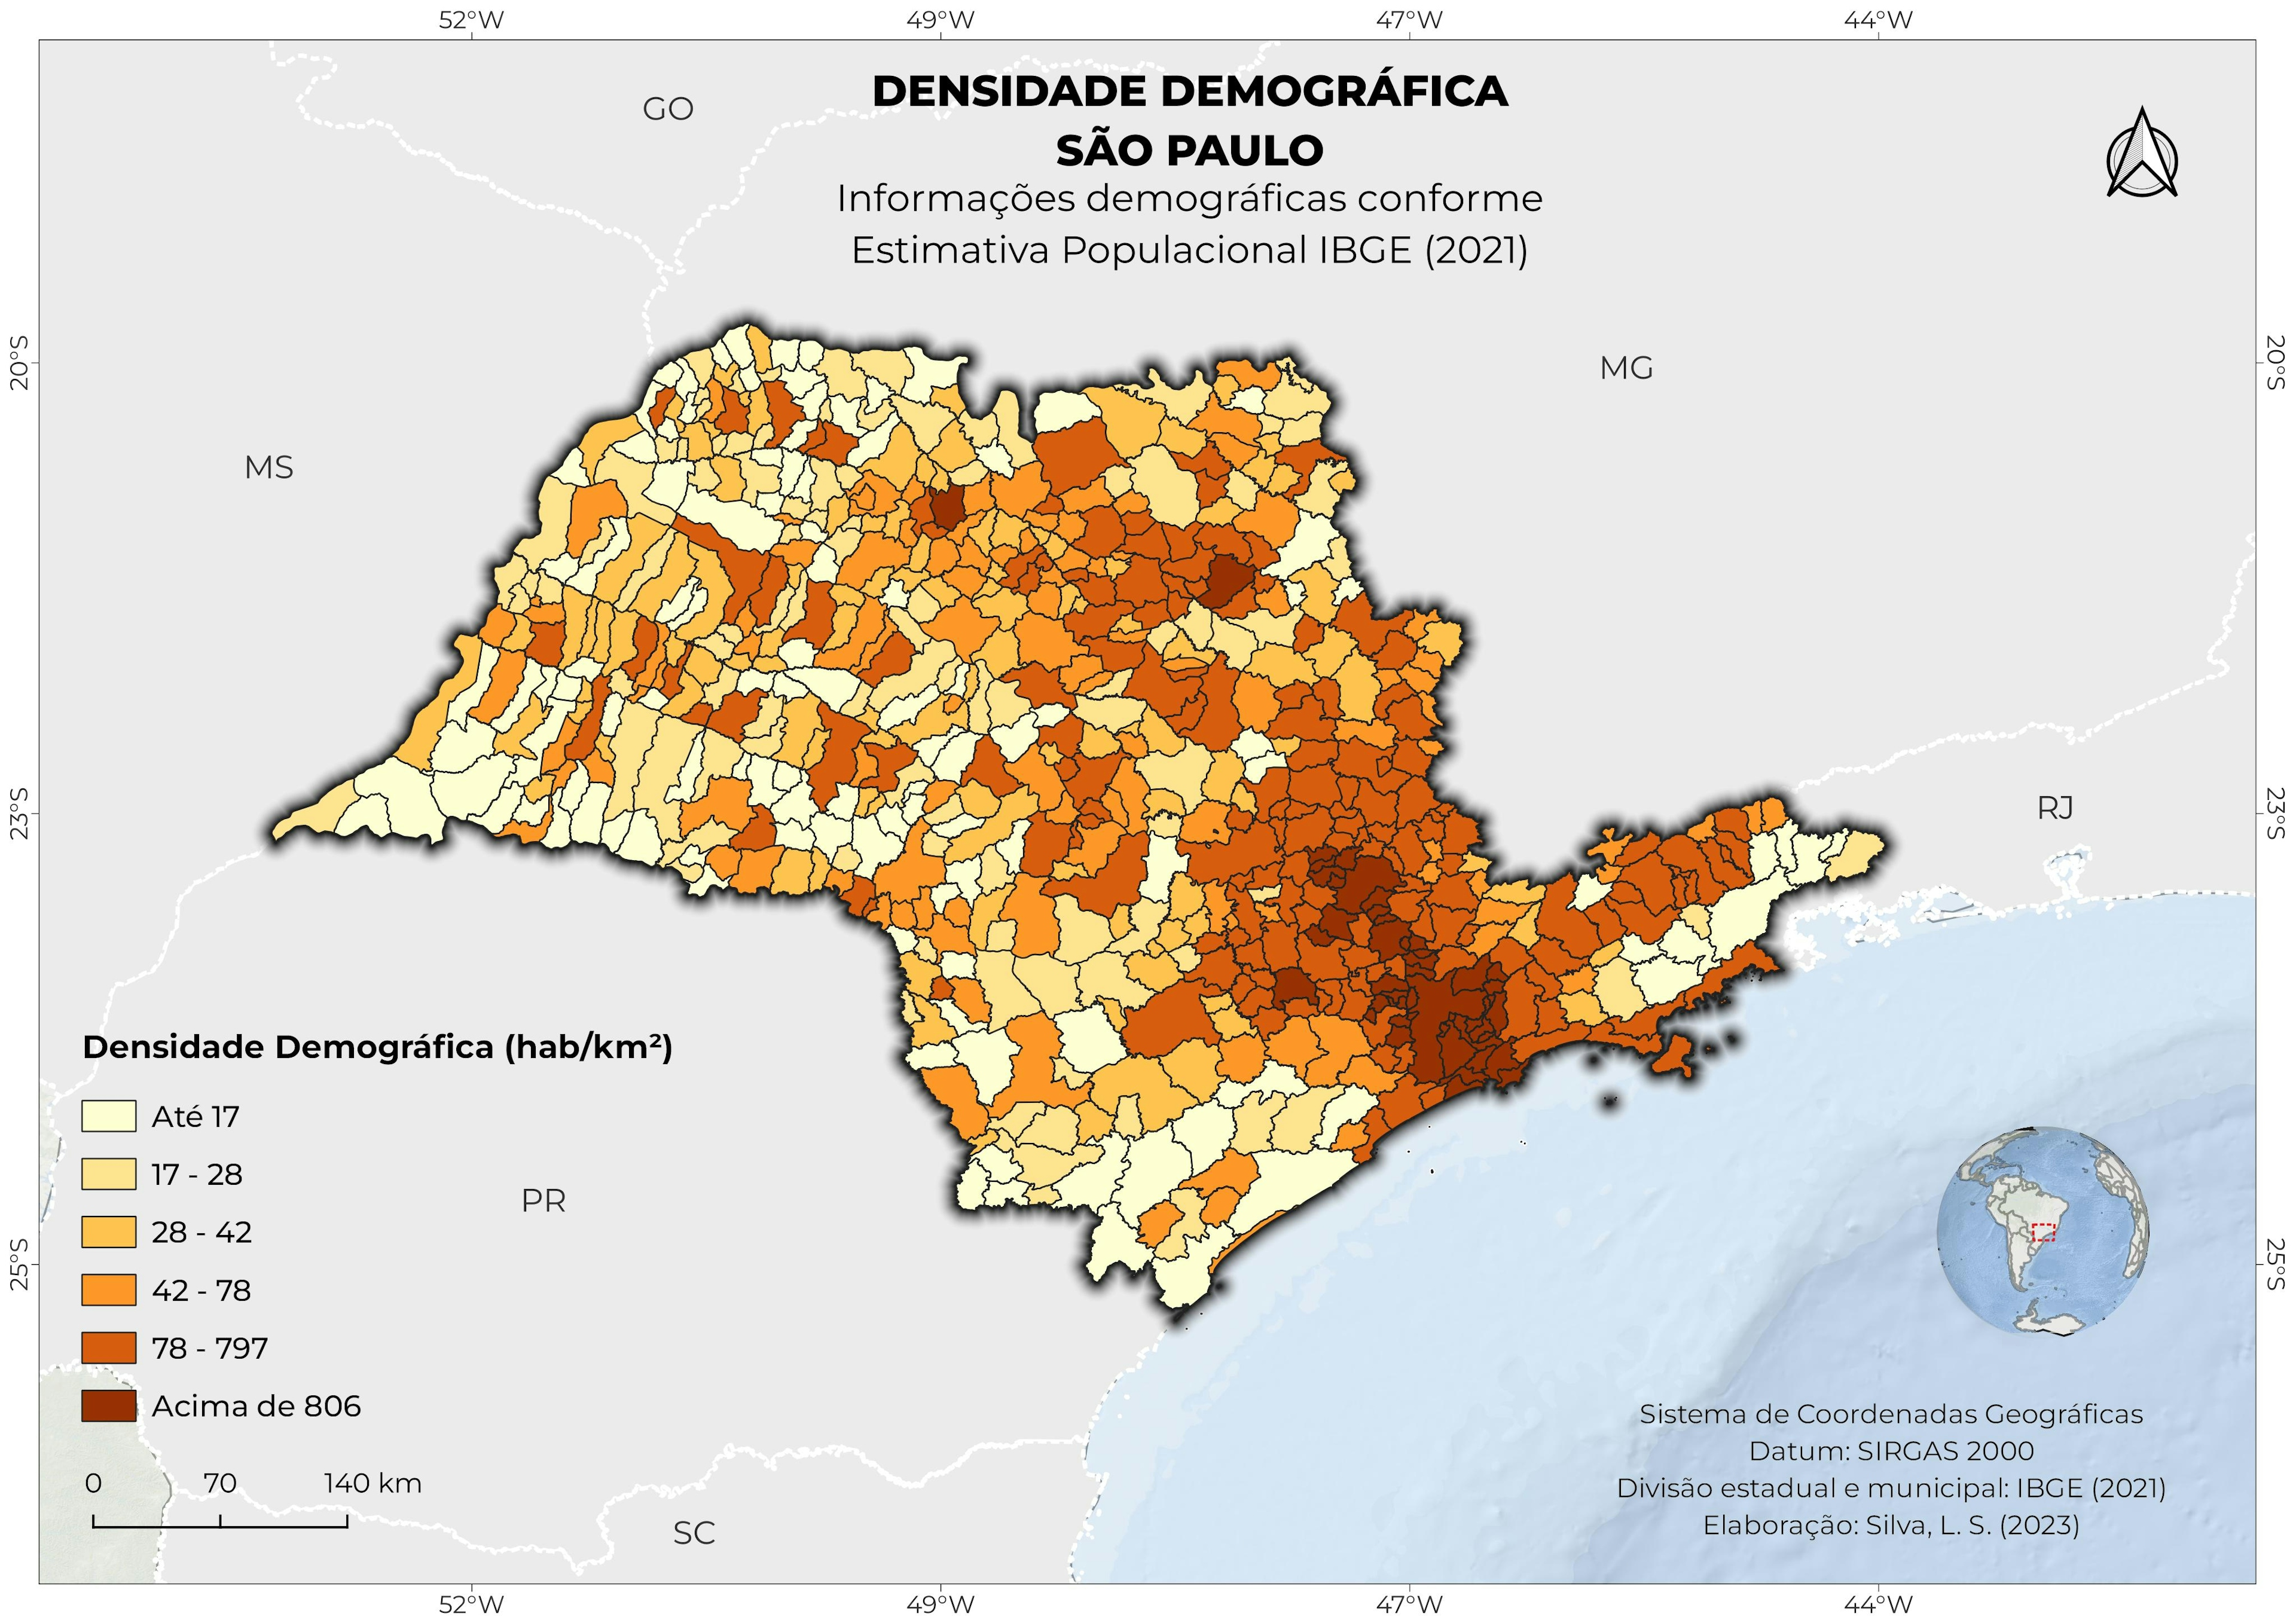
Using Tableau, I was tasked to create maps, charts, and dashboards using COVID-19 and Population data. Can be accessed through this link: Tableau Map Zacarias | Tableau Public
I was taught how to connect XLS, SHP, and DBF Files to Tableau Public.
Perform Table Joins, Join Calculation, and rectifying dubious Table Joins.
Creating various maps with differing classification methods, new worksheets (dragging fields into rows and columns), various graphs (pie, line, bar), and a Tableau dashboard.
Edit Tooltips, creation of a Tableau database, learn spatial visualization tools, and how to publish a Tableau Map.
Using Leaflet JS, I was tasked with acquiring premade scripts via Github, modifying the said code via Notepad++, and running said JS and Geojson code.
Producing three different maps at varying scales and locations. Namely, local (inside the Campus), local government unit (Administrative Boundaries), and Philippines (Country Scale).