

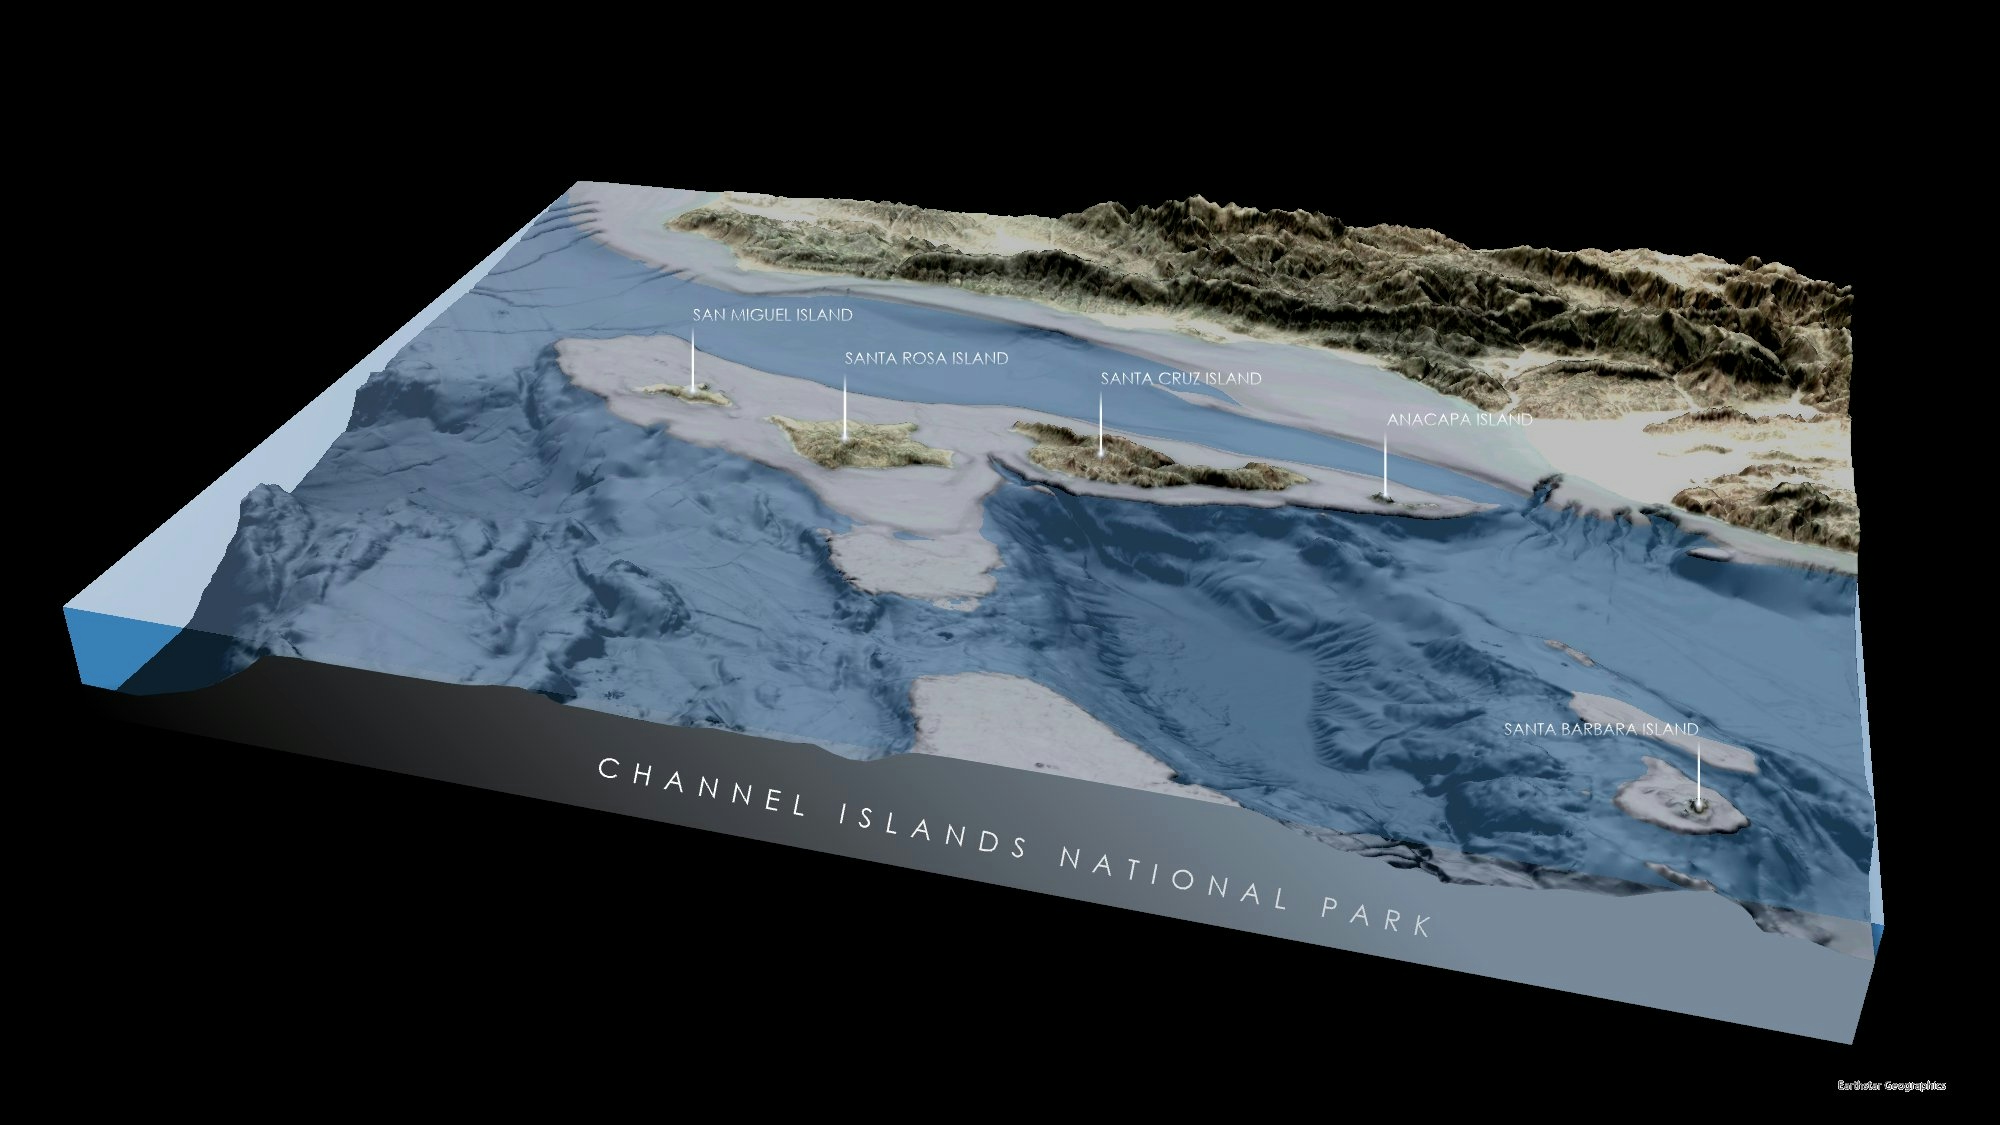
Creating a 3D diorama map like the Straits of Mackinac involves several steps: collecting accurate elevation and bathymetric data, processing satellite imagery, and using GIS tools for spatial analysis. The data is then modeled in 3D software to sculpt the terrain and water depth, applying realistic textures and colors to distinguish land and water features. Artistic touches, such as highlighting significant areas and annotating key points, complete the visual presentation. Precision and creativity are crucial to ensure the map is both scientifically accurate and visually engaging.
3D Diorama Map of Straits of Mackinac
Plug-ins used
ArcGIS Living Atlas of the World
tags
3d mapArcGIS ProData VisualizationDioramatopographic map
More by Oswald Onimhawo


You might also like


Join the community!
We're a place where geospatial professionals showcase their works and discover opportunities.